Special Characters > Using & sign
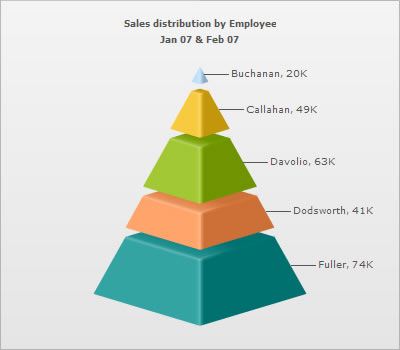
<set label='Buchanan' value='20000' />
<set label='Callahan' value='49000' />
<set label='Davolio' value='63000' />
<set label='Dodsworth' value='41000' />
<set label='Fuller' value='74000' />
</chart>
<div id="chart1div">
This text is replaced by the chart.
</div>
<script type="text/javascript">
var chart1 = new FusionCharts("Pyramid.swf", "ChId1", "400", "350", "0", "0");
chart1.setDataXML("<chart caption='Sales distribution by Employee' subCaption='Jan 07 %26 Feb 07' isSliced='1'><set label='Buchanan' value='20000' /><set label='Callahan' value='49000' /><set label='Davolio' value='63000' /><set label='Dodsworth' value='41000' /><set label='Fuller' value='74000' /></chart>");
chart1.render("chart1div");
</script>