Angular Gauge > Auto-scaling
FusionWidgets v3 angular gauge allows you to auto-scale various objects in the gauge, when scaling a gauge up/down.
For example, consider a chart whose width and height is 260x200 pixels and it uses the following data:
<colorRange>
<color minValue='0' maxValue='75' code='FF654F'/>
<color minValue='75' maxValue='90' code='F6BD0F'/>
<color minValue='90' maxValue='100' code='8BBA00'/>
</colorRange>
<dials>
<dial value='92' rearExtension='10' valueX='130' valueY='100'/>
</dials>
<styles>
<definition>
<style type='font' name='myValueFont' bgColor='F1f1f1' borderColor='999999' />
</definition>
<application>
<apply toObject='Value' styles='myValueFont' />
</application>
</styles>
</chart>
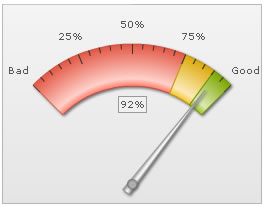
Here, in this XML, we've manually specified the following:
- Gauge Origin X and Origin Y
- Gauge Outer Radius
- Value textbox X and Y position
- Major and minor tick mark height
Let's say, now we want to increase the gauge size by 2, so that width becomes 520 and height 400. If you just increase the width and height of gauge in HTML to 520x400, it will show something as under:
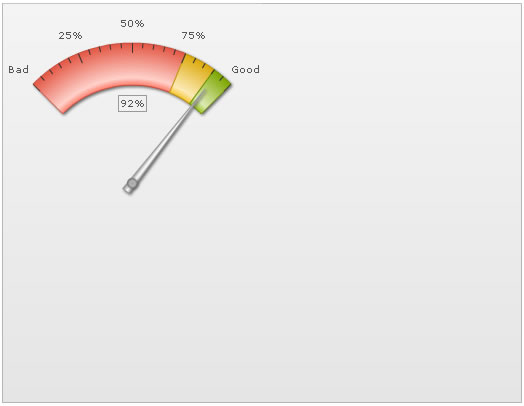
As you can see above, the gauge has not scaled itself to occupy the full chart dimensions. This is because our XML still contains co-ordinates/radius for a smaller chart dimension.
However, there's a way to instruct the gauge to automatically scale everything that was manually specified. To do so, you would need to set:
<chart ... autoScale='1' origW='260' origH='200' ...>
Here, we're first asking the chart to auto scale itself. Thereafter, we've specified the original width and height of chart, based on which we had defined the various co-ordinates/radius in XML. When the chart is now rendered with 520x400 dimensions, it now checks the current dimension against the original width and height specified (in XML), and then scales everything (that was manually specified in the XML) accordingly.
The result would now look as under:
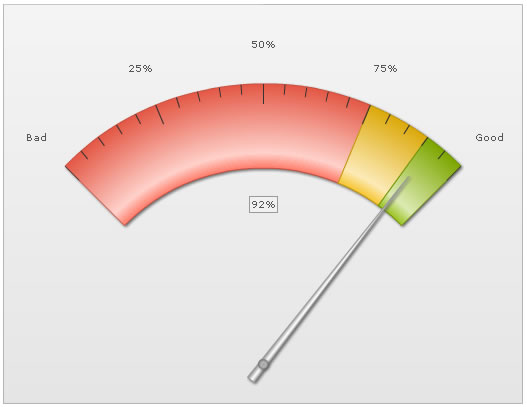
As you can see above, the chart has scaled:
- Gauge Outer radius (keeping the inner radius percentage same)
- Tick mark height
- Gauge Origin X and Origin Y
- Value textbox position
- Tick value distance
Additionally, had you specified manual values for any of the gauge elements listed below, they would have been auto-scaled:
- Gauge outer & inner radius
- Gauge origin X & origin Y
- Pivot Radius
- Individual Dial Radius
- Dial base width
- Dial rear extension
- Dial value x & y position
- Trend-point radius & inner radius
- Trend-marker radius
- Major & Minor Tick mark height
- Tick value distance
As such, you can always be sure that when you're resizing your gauge in constrained proportion, with manually specified values for any of the above elements, FusionWidgets angular gauge can easily scale things for you.
Please note that this auto scaling works perfectly only for constrained resizing i.e., both width and height being multipled by the same factor. If the chart is not scaled in proportions, the gauge will scale in the least possible proportion and then leave empty space at right/bottom.
In a similar way, the annotations present in the gauge can also be scaled. Please see the section Annotations > Auto-scaling to see how to auto-scale annotations.