Angular Gauge > Using STYLEs
The angular gauge can effectively use STYLEs feature to apply animation, effects and font styling to each and every object on the chart.
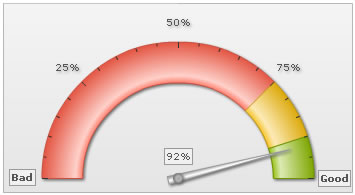
<chart lowerLimit='0' upperLimit='100' lowerLimitDisplay='Bad' upperLimitDisplay='Good' gaugeStartAngle='180' gaugeEndAngle='0' palette='1' numberSuffix='%' tickValueDistance='20' showValue='1'>
<colorRange>
<color minValue='0' maxValue='75' code='FF654F'/>
<color minValue='75' maxValue='90' code='F6BD0F'/>
<color minValue='90' maxValue='100' code='8BBA00'/>
</colorRange>
<dials>
<dial value='92' rearExtension='10'/>
</dials>
<styles>
<definition>
<style type='font' name='myValueFont' bgColor='F1f1f1' borderColor='999999' />
<style type='font' name='limitsFont' bold='1' bgColor='F1f1f1' borderColor='999999' />
<style type='shadow' name='myShadow' />
</definition>
<application>
<apply toObject='Value' styles='myValueFont' />
<apply toObject='Limitvalues' styles='limitsFont' />
<apply toObject='tickvalues' styles='myShadow' />
</application>
</styles>
</chart>
| Object Name | Description | STYLES supported | Animation Parameters |
| BACKGROUND | Background refers to the background for entire chart. |
|
|
| DIAL | All the dials on the gauge. |
|
|
| GAUGE | The color range (qualitative range) for the chart. |
|
|
| PIVOT | The base circle from which dial emanates. |
|
|
| VALUE | Value textfield for the dial (if visible). |
|
|
| TICKMARKS | Tick marks on the gauge scale. |
|
|
| TICKVALUES | Value for tick marks. |
|
|
| LIMITVALUES | Textfield representing chart lower and upper limit. |
|
|
| TRENDPOINTS | All defined trend points for the chart. |
|
|
| TRENDVALUES | Value of defined trend lines. |
|
|
| TRENDMARKERS | Trend-markers, if any. |
|
|
| TOOLTIP | Tool tip for the chart. |
|