Annotations > Auto-Scale
Auto-scaling is a new feature introduced in FusionWidgets v3. Consider this - you make a chart, create lots of annotations for it. And then all of a sudden you have to change the dimensions of the chart for some good reason. What do you do with the annotations? Sit down and change the size and position of each of the annotations individually. Sounds really really tedious...doesn't it? That's exactly where auto-scale comes to the rescue.
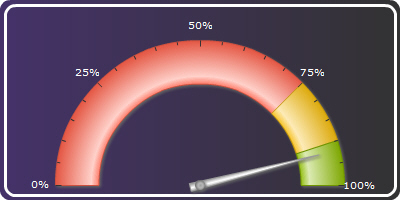
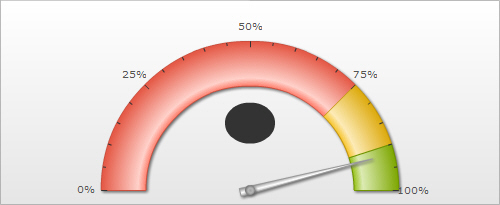
<chart lowerLimit='0' upperLimit='100' gaugeStartAngle='180' gaugeEndAngle='0' numberSuffix='%' bgColor='FFFFFF' showBorder='0' basefontColor='FFFFFF'>
<colorRange>
<color minValue='0' maxValue='75' code='FF654F'/>
<color minValue='75' maxValue='90' code='F6BD0F'/>
<color minValue='90' maxValue='100' code='8BBA00'/>
</colorRange>
<dials>
<dial value='92' rearExtension='10'/>
</dials>
<annotations>
<annotationGroup id='Grp1' showBelow='1'>
<annotation type='rectangle' x='0' y='0' toX='400' toY='200' radius='10' fillColor='333333, 453269' fillAngle='180' />
<annotation type='rectangle' x='5' y='5' toX='395' toY='195' radius='10' color='000000' fillAlpha='0' showBorder='1' borderColor='FFFFFF' borderThickness='3'/>
</annotationGroup>
</annotations>
</chart>
Now if you are more curious about how the angular gauge was made, then please have a look at the Angular Gauge section. But to understand the auto-scale feature, all we need to understand is about the annotations. The chart is 400x200 px in dimension. We have used 2 rectangle annotations in the chart:
- One which makes for the gradient background of the chart
- Another one which makes for the white border we have around the chart
Now for some good reason (we repeat: good), you need to change the dimensions of the chart to 480x240 px and wanted the chart to look like this:
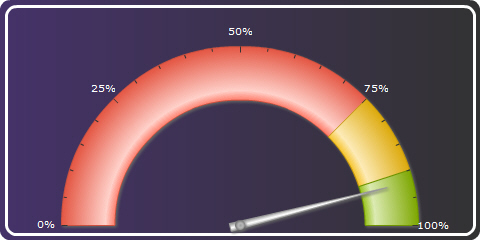
<chart lowerLimit='0' upperLimit='100' gaugeStartAngle='180' gaugeEndAngle='0' numberSuffix='%' bgColor='FFFFFF' showBorder='0' baseFontColor='FFFFFF'>
<colorRange>
<color minValue='0' maxValue='75' code='FF654F'/>
<color minValue='75' maxValue='90' code='F6BD0F'/>
<color minValue='90' maxValue='100' code='8BBA00'/>
</colorRange>
<dials>
<dial value='92' rearExtension='10'/>
</dials>
<annotations origW='400' origH='200' autoScale='1'>
<annotationGroup id='Grp1' showBelow='1'>
<annotation type='rectangle' x='0' y='0' toX='400' toY='200' radius='10' fillColor='333333, 453269' fillAngle='180' />
<annotation type='rectangle' x='5' y='5' toX='395' toY='195' radius='10' color='000000' fillAlpha='0' showBorder='1' borderColor='FFFFFF' borderThickness='3'/>
</annotationGroup>
</annotations>
</chart>
The case we considered above was one in which the width and the height changed by the same factor. So there were no hassles in auto-scaling the annotations. But if this is not the case, as often will be, then we can have 2 kinds of auto-scaling:
- Constrained (by default).
- Unconstrained.
Let's take the following example to understand this better.
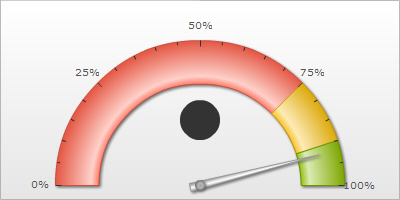
The dimensions of the chart are 400x200 px. Now, we will change its dimensions to 500x205 px. Clearly, the width and height are being change by largely varying factors.
With constrained scaling, this is how the chart would look with its new dimensions.
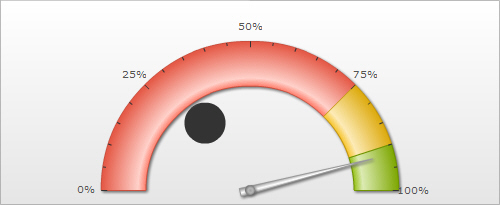
To have unconstrained scaling, we need to set constrainedScale='0' in the <annotations> element. That would give us the following chart for the dimension 500x205 px:
<colorRange>
<color minValue='0' maxValue='75' code='FF654F'/>
<color minValue='75' maxValue='90' code='F6BD0F'/>
<color minValue='90' maxValue='100' code='8BBA00'/>
</colorRange>
<dials>
<dial value='92' rearExtension='10'/>
</dials>
<annotations origW='400' origH='200' constrainedScale='0'>
<annotationGroup id='Grp1' showBelow='1'>
<annotation type='circle' startAngle='0' sendAngle='180' x='200' y='120' radius='20' fillColor='333333'/>
</annotationGroup>
</annotations>
</chart>
There would be times when using auto-scaling that you would want to auto-scale some annotations while keep the rest of them the way they were - the original position and size. This would be particularly true when some of the annotations you have are images and text.
Lets take this example:
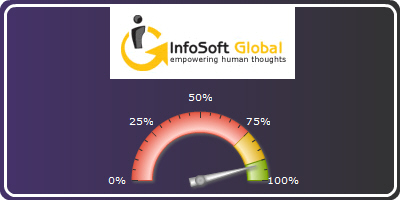
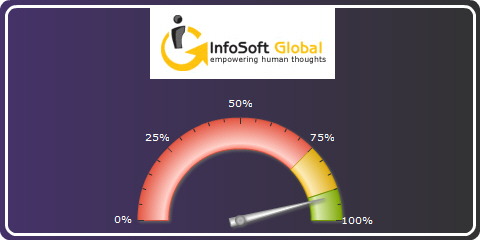
How do we go about it? Its pretty easy to make out that while the 2 rectangles in the background have been auto-scaled, the logo at the top hasn't been. So, here instead of using the autoScale attribute in the <annotations> elelement which auto-scales all the annotations, we would use it in <annotationGroup> element and then auto-scale only those groups which we want to. As common sense would have it, we have made 2 annotation groups:
- One with the 2 rectangles which make for the background and border of the chart
- One with the logo
We would still define the original width and height in the <annotations> element itself, because to control auto-scaling, the autoScale attribute is sufficient. Then we would set autoScale='1' for the 1st group and set autoScale='0' for the 2nd group. So, our XML would look as:
<chart lowerLimit='0' upperLimit='100' gaugeStartAngle='180' gaugeEndAngle='0' numberSuffix='%25' chartTopMargin='100' bgColor='FFFFFF' showBorder='0' chartBottomMargin='20' basefontColor='FFFFFF'>
<colorRange>
<color minValue='0' maxValue='75' code='FF654F'/>
<color minValue='75' maxValue='90' code='F6BD0F'/>
<color minValue='90' maxValue='100' code='8BBA00'/>
</colorRange>
<dials>
<dial value='92' rearExtension='10'/>
</dials>
<annotations origW='400' origH='200'>
<annotationGroup id='Grp1' showBelow='1' autoScale='1'>
<annotation type='rectangle' x='0' y='0' toX='400' toY='200' radius='10' fillColor='333333, 453269' fillAngle='180' />
<annotation type='rectangle' x='5' y='5' toX='395' toY='195' radius='10' color='000000' fillAlpha='0' showBorder='1' borderColor='FFFFFF' borderThickness='3'/>
</annotationGroup>
<annotationGroup id='Grp2' showBelow='0' autoScale='0'>
<annotation type='image' x='110' y='7' URL='logo.gif' />
</annotationGroup>
</annotations>
</chart>
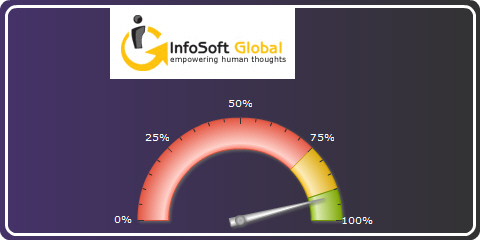
Since we have disabled the auto-scaling feature for the logo image, it remains in the same size and position as it was earlier. So, we need to shift it a little to the right. The xShift atribute comes into use here. It can be used with the <annotations> element when all the annotations in the chart have to be 'x-shifted' or with <annotationGroup> element when a particular annotation group has to be 'x-shifted' and not all the annotations on the chart. In this case, only the annotation group with the logo in it has to be shifted.
Similarly, there is a yShift attribute which too can be used with both the <annotations> and <annotationGroup> element.
Setting xShift='40' for Grp2 would give us our desired result.