Annotation > Text
Let us take a look at the Text Annotation here. The Text annotation looks like just any other text on the chart - just that you can place any number of text annotations anywhere on the chart. A text annotation would look as under:
...
<annotations>
<annotationGroup id='Grp1' >
<annotation type='text' x='200' y='200' label='Text' />
</annotationGroup>
</annotations>
...
</chart>
 |
 |
 |
| Attribute Name | Type / Range | Description |
| type | Rectangle, Circle, Polygon, Line, Arc, Text, Image | Needs to be set to Text to create a rectangle annotation type. |
| x | Number | The starting x co-ordinate for the annotation. This x co-ordinate is relative to the x co-ordinate of the annotation group in which the annotation is placed. For example, if you have set the x co-ordinate of the annotation group as 50 and the x co-ordinate of the annotation is 100, then th effective x co-ordinate of the annotation would be 150 w.r.t to the starting position of the chart. |
| y | Number | The starting y co-ordinate for the annotation. This again is relative to the starting y co-ordinate of the annotation group in which the annotation is placed. |
| color | Hex Color (without the '#') | A generic color for the annotation from which fill color and border color (whichever applies) will be derived automatically. |
| label | String | Herein, you specify the text that you want to displayed using the text annotation. |
| align | left/center/right | This attribute sets the horizontal alignment of the text. Default value: center. |
| vAlign | top/middle/bottom | This attribute sets the vertical alignment of the text. Default value: middle. |
| font | Font Face | This attribute sets the font name in which you want the text label to be displayed in. Default Value: Verdana |
| fontSize | Number | This attribute sets the font size of the text label. Default value: 10 |
| fontColor | Hex code (without the '#') | This attribute sets the font color of the text label. By default, the value is the same as defined by the generic color attribute. |
| bold | Boolean (0 or 1) | Whether the text would be bold or not. |
| italic | Boolean (0 or 1) | Whether the text would be italicized or not. |
| underline | Boolean (0 or 1) | Whether the text would be underlined or not. |
| letterSpacing | Number | The letter spacing for the text. Default value: 0. |
| leftMargin | Number | The margin to the left of the text. |
| bgColor | Hex code (without the '#') | The background color of the box in which the text is placed. |
| borderColor | Hex code (without the '#') | The border color of the text box. |
| wrap | Boolean (0 or 1) | This attribute lets you define whether you want the text to be wrapped or not to the next line. |
| wrapWidth | Number | The maximum width after occupying which, the remaining text(if any) would be wrapped to the next line. |
| wrapHeight | Number | The maximum possible height you would need for the texbox if you have set wrapping on. |
<chart ... >
...
<annotations>
<annotationGroup>
<annotation type='rectangle' xPos='120' yPos='60' toXPos='280' toYPos='120' radius='0' fillcolor='333333' fillAlpha='5'/>
<annotation type='line' xPos='120' yPos='60' toYPos='120' color='333333' thickness='2'/>
<annotation type='line' xPos='280' yPos='60' toYPos='120' color='333333' thickness='2'/>
<annotation type='line' xPos='120' yPos='60' toXPos='125' color='333333' thickness='2'/>
<annotation type='line' xPos='120' yPos='120' toXPos='125' color='333333' thickness='2'/>
<annotation type='line' xPos='275' yPos='60' toXPos='280' color='333333' thickness='2'/>
<annotation type='line' xPos='275' yPos='120' toXPos='280' color='333333' thickness='2'/>
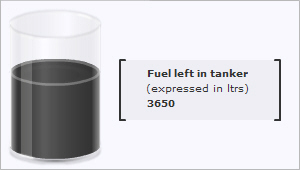
<annotation type='text' label='Fuel left in tanker' font='Verdana' xPos='145' yPos='65' align='left' vAlign='left' fontcolor='333333' fontSize='10' isBold='1'/>
<annotation type='text' label='(expressed in ltrs)' font='Verdana' xPos='144' yPos='80' align='left' vAlign='left' fontcolor='333333' fontSize='10'/>
<annotation type='text' label='3650' font='Verdana' xPos='145' yPos='95' align='left' vAlign='left' fontcolor='333333' fontSize='10' isbold='1'/>
</annotationGroup>
</annotations>
</chart>