Bulb Gauge > Creating a simple chart
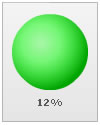
In our first bulb gauge, we would be plotting Attrition Rate from 0-100%. The final outcome would be:
The various tasks involved in building this chart are:
- Defining the minimum and maximum value which would be plotted on the gauge scale. They are termed as the lower and upper limits of the gauge scale and in this case setting them to 0 and 100 respectively would suit our purpose just fine - as we're plotting the chart indicating a %, which cannot go below 0 or beyond 100.
- Dividing the values into pre-determined regions:
0-15%: Low Attrition Rate (the bulb would shown in green when the value is in this region)
15-35%: Medium Attrition Rate (bulb would be yellow in this region)
35-100%: High Attrition Rate (bulb would be red in this region)
- Passing the data value to the chart, 12 in the above chart. Since 12 lies in the 1st pre-determined region, i.e. of the Low Attrition rate, the entire bulb is shown in green.
With the tasks defined, now lets get to the XML side of things.
<colorRange>
<color minValue='0' maxValue='15' label='Low' code='00FF00' />
<color minValue='15' maxValue='35' label='Medium' code='FFFF00' />
<color minValue='35' maxValue='100' label='High' code='FF0000' />
</colorRange>
<value>12</value>
</chart>
First of all comes the <chart> element which is the starting element for any chart that you create using FusionWidgets. Now we define the lower and upper limits of the gauge scale. To define the limits, we use the lowerLimit and upperLimit attributes of the <chart> element.
We also set the palette number and number suffix (the character which would show up at the end of end number).
There are other attributes of the <chart> element which we would not be delving into now, because of this being a really basic chart.
Next, we need to define our color range. As we had earlier seen, this chart has 3 color ranges. To define the color range, we use the <colorRange> element, which is an immediate child of the <chart> element. Under each <colorRange> element, we place a <color> element specifying a single color range as shown in the code below.
<color minValue='0' maxValue='15' label='Low' code='00FF00' />
<color minValue='15' maxValue='35' label='Medium' code='FFFF00' />
<color minValue='35' maxValue='100' label='High' code='FF0000' />
</colorRange>