Bullet Graphs > Overview
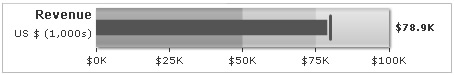
A bullet graph is a variation of a bar graph that serves as a replacement for dashboard gauges and meters. Bullet graphs overcome the fundamental issues of gauges and meters which typically require too much space and are cluttered with distracting decoration.
The bullet graph features a single, primary measure (for example, current year-to-date revenue), compares that measure to one or more other measures to enrich its meaning (for example, compared to a target), and displays it in the context of qualitative ranges of performance, such as poor, satisfactory, and good.
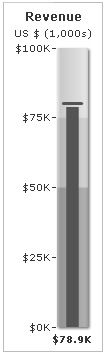
Bullet graphs may be orientated horizontally or vertically, and multiple graphs may be stacked to allow comparisons of several measures at once. Shown below are bullet graphs that can be created using FusionWidgets:
- Ability to plot the value as filled bar or as dot
- Option to show/hide axis division values
- Option to show/hide chart value
- Customizable axis limits
- Customizable tick marks & values
- Fully customizable plot cosmetics
- Ability to draw round color range bar