Cylinder Gauge > Configuration
The cylinder gauge chart from FusionWidgets suite offers you a lot of configuration options. Here, we'll see how to:
- Using palettes
- Customizing cylinder origin, radius & height
- Setting cylinder fill color
- Hiding chart value
- Configuring tick marks & values
Let's see each of them one by one.
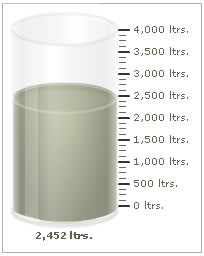
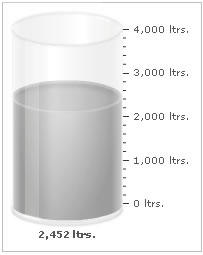
The cylinder gauge offer 5 pre-defined color palettes for you to choose from. Each of these palettes are accessible by the number 1-5. To choose a palette, all you need to do is set:
<chart palette='2' or '3' or ..>
Shown below are a few examples of palettes applied on our previous chart:
 |
 |
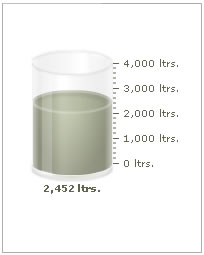
Palette 1 applied |
Palette 2 applied |
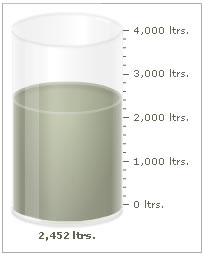
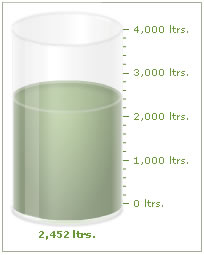
Additionally, you can also define an entire new palette by setting a single theme color using:
<chart paletteThemeColor='669933' ..>
This will create a new palette derived from this color and then color the chart as under:
By default, FusionWidgets automatically calculates the best-fit co-ordinates and size for cylinder. However, if for some reason, you need to specify your own sizes for the gauge, you can do so using:
<chart ... cylOriginX='30' cylOriginY='160' cylRadius='40' cylHeight='100' ...>
Here, we've changed the origin of the cylinder, its radius and height. Origin of the cylinder refers to the bottom left portion of the cylinder. This results in:
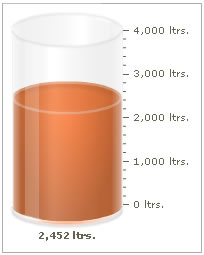
You can set the cylinder fill color using:
<chart ... cylFillColor='ff5904' ...>
This results in:
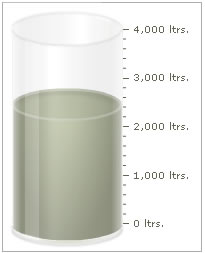
You can hide the chart's value using:
<chart ... showValue='0' ...>
This results in:
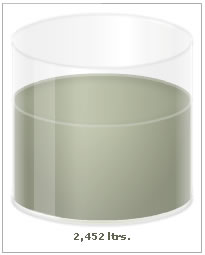
You can opt to hide all tick marks & values using:
<chart ... showTickMarks='0' showTickValues='0' ...>
This will result in:
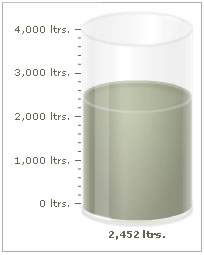
You can place the ticks to the left or right of cylinder using:
<chart ... ticksOnRight='0' ...>
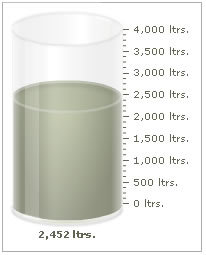
You can configure the number of tick marks as under:
<chart ... majorTMNumber='8' minorTMNumber='3' ...>
It will result in:
The chart can automatically adjusted the number of major ticks to a best feasible value. However, if you do not want the chart to do the same, you can add:
<chart ... adjustTM='0' majorTMNumber='8' minorTMNumber='3' ...>
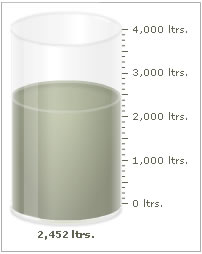
You can opt to show every nth tick value by setting:
<chart ... tickValueStep='2' ...>
This will result in every 2nd major tick mark's value being shown, as under:
You can configure tick mark cosmetics using:
<chart ... majorTMColor='333333' majorTMAlpha='100' majorTMHeight='10' majorTMThickness='2' minorTMColor='666666' minorTMAlpha='100' minorTMHeight='7' minorTMThickness='1' tickMarkDistance='2'...>
This will result in: