Cylinder Gauge > Creating a gauge
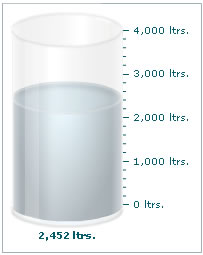
We will create our first cylinder gauge to depict the amount of petrol left in a fuel tanker, whose capacity is 4000 litres. We'll show a value of 2452 litres. The final gauge would look as under:
To create this chart, our tasks can be broken down into the following segments:
- Deciding the minimum and the maximum value that would be plotted on the chart. The minimum value is called the lower limit and the maximum value is termed as the upper limit. The limits are displayed on the vertical scale to the left/right of the cylinder. Since we are plotting the amount of fuel left in a tanker, the lower and upper limits have been set to 0 litres and 4000 litres respectively.
- Plotting the desired value on the chart which would be depicted by filling up the cylinder to that level on the scale. We've set it to 2,452 litres here.
<value>2452</value>
</chart>
First of all comes the <chart> element which is the starting element for any chart that you create using FusionWidgets. Now we define the lower and upper limits of the gauge scale. To define the limits, we use the lowerLimit and upperLimit attributes of the <chart> element.
We also set the palette number and number suffix as ' ltrs.'