Data-streaming charts > Getting data using JavaScript
The data-streaming charts also allow you to get the current view state of data (i.e., the data which is currently being shown on the chart) using JavaScript.
Additionally, the charts allow you to track events in JavaScript whenever new data is provided to the chart (either from real-time data provider page or using JavaScript).
If you wish, you can track the event of chart data update - i.e., each time the chart fetches new data and updates itself, it can notify you by calling a JavaScript method. The method is named as FC_ChartUpdated(DOMId).
To enable this, you'll first need to set registerWithJS flag of the chart to 1:
//Check if DOMId is that of the chart we want
if (DOMId=="ChId1"){
//Get reference to the chart
var chartRef = getChartFromId(DOMId);
//Now you can do anything with the chart...
}
}
As you can see above, whenever a real-time chart (present in this page) receives new data (from data provider page or even JavaScript feedData() method), it will now call FC_ChartUpdated() method and pass its DOM Id to this method.
If you've multiple data-streaming charts on the same page, you can use DOMId to track which chart was updated, and based on that, take future actions.
//Check if DOMId is that of the chart we want
if (DOMId=="ChId1"){
//Get reference to the chart
var chartRef = getChartFromId(DOMId);
//Get the current view state data of chart (in array)
var arrData = chartRef.getData();
//Update our display container
updateDisplay(arrData);
}
}
In the above code, we've combined FC_ChartUpdated() and getData() method.
Whenever a chart (with ID as ChId1) updates in the page, this function is invoked. In this function, we get the new data of chart in a JavaScript array using getData() method and then pass it to another custom function called updateDisplay().
The structure of the array returned by getData() function is as under:
| [0,0] - Empty | [0,1]- Dataset series name | [0,2] - Dataset series name | [0,n]- Dataset series name |
| [1,0] - Category label of data index 1 | Data for dataset [1] data index [1] |
Data for dataset [2] data index [1] |
Data for dataset [n] data index [m] |
| [2,0] - Category label of data index 2 | Data for dataset [1] data index [2] |
Same as above | Same as above |
| [m,0] - Category label of data index m | Data for dataset [n] data index [m] |
Same as above | Same as above |
| [m,0] - Category label of data index m | Same as above | Same as above | Same as above |
| [m,0] - Category label of data index m | Same as above | Same as above | Same as above |
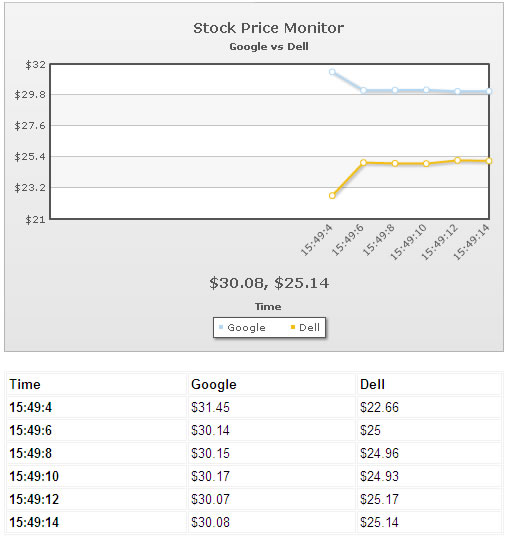
We'll build further on our previous Multiple dataset example, where we were comparing the stock prices of Dell and Google. This time, we'll extend it to show the data retrieved by chart in a table that'll be controlled by JavaScript. That is:
- The chart will function normally and retrieve the data for both Dell & Google from the data provider page.
- We'll enable to chart to register with JavaScript.
- Now, whenever the chart's data is updated, our FC_ChartUpdated() method will be invoked.
- Here, we'll get the data of chart using getData() method.
- Finally, we'll convert the data in this array in a presentable HTML table.
The following code (contained in Download Package > Code > RealTime > GetData_JS.html) does the trick:
<HEAD>
<script type="text/javascript" src="../Charts/FusionCharts.js"></script>
<script language="javascript">
//FC_ChartUpdated method is called when any real-time chart present in the
//page has received new data (either from data-provider page or from JavaScript)
function FC_ChartUpdated(DOMId){
//Check if DOMId is that of the chart we want
if (DOMId=="ChId1"){
//Get reference to the chart
var chartRef = getChartFromId(DOMId);
//Get the current view state data of chart (in array)
var arrData = chartRef.getData();
//Update our display container
updateDisplay(arrData);
}
}
//This method is called when the chart has updated.
function updateDisplay(arrData){
//Here, we access the array of data, build HTML code to represent
//the same data and finally update the page display container.
var i,j;
var tableCode = "<table width='500' align='center' border='1' bordercolor='#f1f1f1' cellpadding='2' cellspacing='1'>";
//Iterate through each row in the array;
//Note: arrData[0][0] is empty
//arrData[0][i] contains data set series names
//arrData[i][0] contains category labels (x-axis labels)
//Rest of the cells contain data in numeric format (or null).
for (i=0; i<arrData.length; i++){
//Create a table row for each row
tableCode = tableCode + "<tr>";
for (j=0; j<arrData[i].length; j++){
//If it's the first row, we add data set series name
if (i==0){
//if it's the first cell [0][0], we add "Time" as header
if (j==0){
tableCode = tableCode + "<td class='textBold'>Time</td>";
}else{
tableCode = tableCode + "<td class='textBold'>" + arrData[i][j] + "</td>";
}
}else{
//If it's first cell, we add it as category label, else as normal
if (j==0){
tableCode = tableCode + "<td class='textBold'>" + arrData[i][j] + "</td>";
}else{
//We add data only if it's not null
if (arrData[i][j]!=null){
tableCode = tableCode + "<td class='text'>$" + arrData[i][j] + "</td>";
}else{
tableCode = tableCode + "<td class='text'> </td>";
}
}
}
}
//Close row
tableCode = tableCode + "</tr>";
}
//Close table element
tableCode = tableCode + "</table>";
//Update the DIV container with this.
var divC = document.getElementById("tableDiv");
divC.innerHTML = tableCode;
//Return
return;
}
</script>
<style type="text/css">
.text{
font-family:Arial, Helvetica, sans-serif;
font-size:10pt;
}
.textBold{
font-family:Arial, Helvetica, sans-serif;
font-size:10pt;
font-weight:bold;
}
</style>
</HEAD>
<BODY>
<CENTER>
<div id="chart1div">
This text is replaced by the Flash movie.
</div>
<script type="text/javascript">
var chart1 = new FusionCharts("../Charts/RealTimeLine.swf", "ChId1", "500", "350", "0", "1");
chart1.setDataURL("MultipleDS.xml");
chart1.render("chart1div");
</script>
<BR>
<DIV id="tableDiv">
<table width="500" align="center" border="1" bordercolor="#f1f1f1" cellpadding="2" cellspacing="1">
<tr>
<td align='center'>
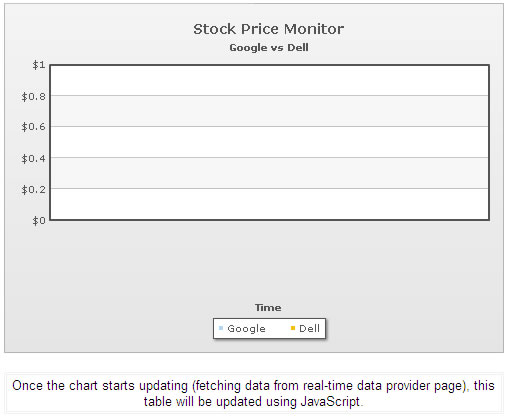
<span class='text'>Once the chart starts updating (fetching data from real-time data provider page), this table will be updated using JavaScript.
</td>
</tr>
</table>
</DIV>
</BR>
</BODY>
</HTML>