Exporting Charts as PDF or Images > Terminologies
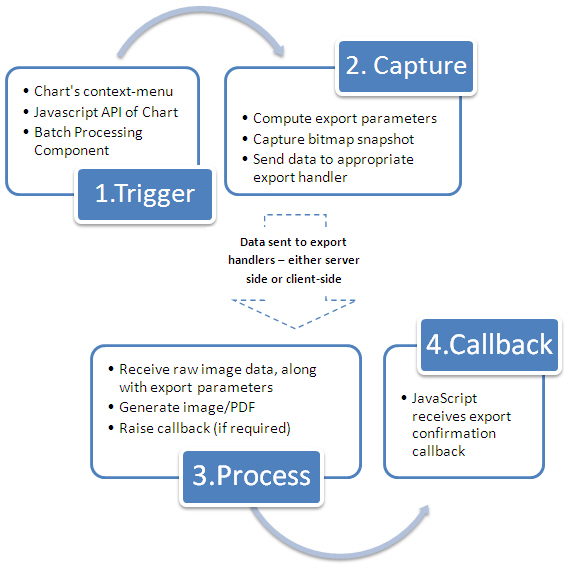
The entire process of exporting a FusionCharts chart to image/PDF, whether on server-side or client-side, is called Export Process. The export process has various phases, as listed below in sequential order:
- Trigger Phase - The phase during which user chooses to export the chart. This can be invoked using the context menu of the chart, JavaScript API of the chart, or using the batch export component.
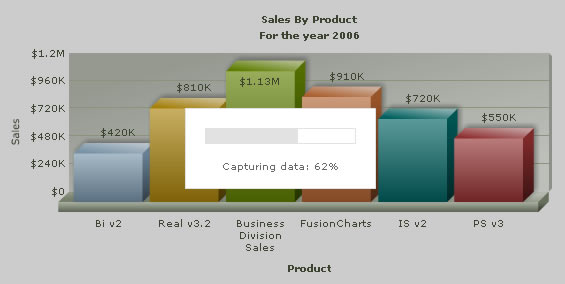
- Capture Phase - The phase during which the chart takes a bitmap snapshot of itself and processes it for passing to export handlers.
- Process Phase - In this phase, the export handlers accept the bitmap data from chart and process it for output.
- Callback Phase - This is the last and final phase, in which you get the exported image/PDF from chart. You can also invoke a callback JavaScript function here to notify your scripts that the exporting of chart has completed.
In terms of these phases, the entire export process can be visualized as under:
FusionCharts, by itself, cannot directly export the charts as images. It needs help from either server-side scripts, or other client side Flash movies (coded in Flash 10) to accept the bitmap snapshot sent by FusionCharts, and to convert that as image/PDF. These are called FusionCharts Export Handlers.
If you're wondering why we have to make use of another Flash 10 SWF to build the client-side Export Component when FusionCharts itself is a Flash movie, let us explain.
FusionCharts has been coded in Flash 8 and ActionScript 2.0. This version of ActionScript doesn't have support for handling bye streams, and as such we cannot generate image or PDF streams. Flash 10 came with added capabilities of allowing the byte stream to be downloaded as a file from browser itself. However, it came with a side-effect- the end-user has to click on something to initiate the download - and so, we had to force a button in our FusionCharts Export Component UI to initiate the download process.
The export handlers are present in two variants:
- FusionCharts Server-side Export Handlers
- FusionCharts Export Component (or, FusionCharts Client-side Export Handler)
Let's quickly run through each of them.
The server-side export handlers help you export FusionCharts as images/PDF using help of scripts that are placed on your servers. These are ready-to-use scripts that we provide in the following programming languages:
- ASP.NET
- PHP - Uses GD and GZIP library installed on your server to generate output
- Ruby on Rails - Uses RMagick and zlib installed on your server to generate output
- Java
The scripts are present in Download Pack > ExportHandlers > {Your_Programming_Language} folder
These scripts accept compressed bitmap data from FusionCharts (over HTTP or HTTPS) and convert the same into images/PDFs. Post conversion, you've two options:
- Save the generated output (image/PDF) on server disk. This allows you to use these images later for embedding in your emails/reports.
- Or send it back to browser so that your user can download it.
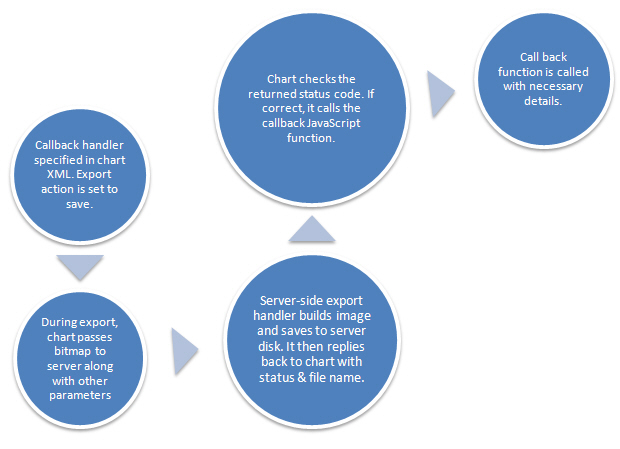
This choice can be configured in each chart's XML attributes related to export-chart routine. A simple save on server and callback routine can be visualized as under:
The client-side FusionCharts Export Component, which is called FusionCharts Export Component for the sake of brevity, helps you bypass all server scripts and save the charts as images/PDFs at client side only. This is particularly useful in these scenarios:
- You do not have a server which supports any of the aforementioned technologies.
- You do not want to transfer bitmap data between your client and server. The client side export is faster than server-side, as bitmap data does not need to be transferred (the data could run into a few hundred KB if the size of chart is big).
The FusionCharts Export Component is a Flash 10 SWF file, similar to FusionCharts which are Flash 8 SWF files. This component is accompanied by a FusionCharts Export Component JavaScript class (FusionChartsExportComponent.js) that helps you to:
- Include the FusionCharts Export Component in your web page in a very simple way
- Helps you configure the functional and visual parameters of Export Component
- In case of batch process (explained later), helps you choose the charts to be put in batch queue and to initiate the batch process
FusionCharts Export Component is named as FCExporter.swf and is present in Download Package > Charts folder. The JavaScript class is named as FusionChartsExportComponent.js and is present in Download Package > JSObject folder.
To use the client-side export component, there are four steps you need to follow:
- Include the JavaScript class in your web page
- Create a DIV in your web page which will contain this component. You can place that DIV anywhere in the page, but ideal locations are above/below/side of the chart, as the component shows a button, which when clicked, actually downloads the image/PDF file.
- Set a few lines of JavaScript code required for initialization and for naming this instance of the component. This code also lets you configure the visual look of the component in your page.
- Create the chart in your page, as you normally do and configure its XML to enable export, and to use the above created instance of the component. Make sure to set the registerWithJS flag of each chart as 1. Without this, client-side communication cannot happen between multiple Flash movies.
And you're done - the rest of the things are automatically taken care of by our JavaScript class and export component. When your users now use the context menu to export the chart, the JavaScript and export component come into play - they accept the bitmap data from chart using our JavaScript communication bridge, process it, and finally allow a download of the same.
This component is also used for batch export process, as explained next.
FusionCharts Export Component also allows you to export all the charts contained in a web page as a single image/PDF at the click of a single button. This process is called batch export. The following steps are involved in batch export process:
- Include the relevant FusionCharts classes in your web page - the standard FusionCharts JavaScript class, and export component related classes
- Create an empty DIV in your web page, in which the User Interface of the Export Component will appear (Remember, the export component is a Flash 10 movie which can be placed within any DIV).
- Embed the charts in your web-page. Make sure to set the registerWithJS flag of each chart as 1. Without this, client-side communication cannot happen between multiple Flash movies.
- Set a few lines of JavaScript code to setup the batch process. This code:
- Initializes the Export Component for batch process
- Helps you select which charts (present on that web page) you want to include in the batch export process
- Configure the output format (JPEG/PNG/PDF)
- Configure the cosmetic properties of batch export component UI. Remember that the Export Component shows up as a UI on your web page - either as a small button, or an advanced UI allowing download of multiple charts.
- Now, when your user clicks on the button present in our FusionCharts Export Component UI, the batch process contacts each chart on the page to start the "Capture phase". Post this phase, the charts pass the compressed bitmap data to the batch component, which in turn processes all of them, and finally allows the user to download the same.
- The export component has multiple configuration options for UI and for allowing of download of exported charts - you can configure it to allow download of individual files, or all files at one.
The list of charts that is handled in a given batch export process is called the batch queue.
Again, in this process, there is a lot of JavaScript communication happening behind the scenes. All of this is handled for you by our JavaScript classes - FusionCharts.js and FusionChartsExportComponent.js.
FusionCharts Export Component (client-side) needs to be placed in your web page as a visual element to enable client-side saving of chart. This is necessary as the users need to click on something to be able to download the exported image/PDF. The UI of this component can be rendered in two modes:
- Compact Mode - Where it shows a very simple button, which when clicked, begins the download. In this mode, the user cannot choose a format for download. The default format as specified in XML (or over-riding JavaScript API) is used.
- Full Mode - In this mode, the Export Component shows a list of all charts that have transferred their bitmap snapshot to it. You can then download individual charts and choose download format for the same. Or, you can also download all the charts exported as a single PDF/image - this depends on the saving mode set for Export Component.
The export component allows you to save each chart individually, or all files together as a single image/PDF. This is made possible using the UI present in Export Component.
There are a total of 4 modes that you can select:
- Self - This mode is primarily used when exporting individual charts as images.
- Individual - In case of batch mode, you can have each chart in batch queue download individually as a separate export file (image/PDF)
- Batch - In case of batch mode, you can also choose to have all the charts in batch queue downloaded only as a single export file. In case of images, each chart's output is placed vertically one after another in a single image. In case of PDF, each page in the output PDF contains one chart.
- Both - In batch mode, this option allows the user to use both the options - download each chart as a separate file, or to download a single file for the entire batch queue.
The UI of Export Component also depends on the saving mode selected.
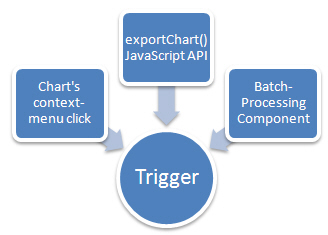
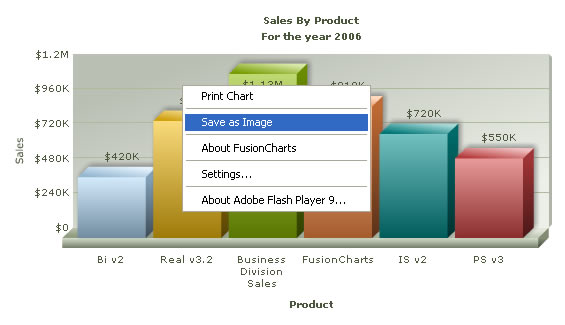
Here, using the chart XML, you can configure the following:
- Re-order the sequence of export formats, or opt to show only selected formats (instead of all 3)
- Change the label of each context menu item (e.g., "Save as JPEG Image") to your own label.
- Opt not to show any export related attributes in context menu at all. Then the chart could be exported using its JavaScript API only.
The exportChart() JavaScript API is one of the trigger methods that can be used to invoke chart export process. This method works only when the registerWithJS flag of chart is set to 1. Using this API, you can:
- Initiate the export process of a specific chart on the web page
- Provide over-riding export parameters. By default, you specify the export related parameters of a chart in its XML. But, if at run-time, you wish to over-ride it for any individual chart, you can do so using this API.
