Creating your First Chart > Creating your First Chart
Here, we'll guide you through the process of creating your first chart. For a head start, we'll create a simple angular gauge (speedometer chart) to visually depict "Customer Satisfaction %" for a fictional company.
Like FusionCharts, to create any chart using FusionWidgets, you need to assemble four things:
- SWF File for the chart that you want to create. We want to create an angular gauge whose SWF file is named as AngularGauge.swf. All the chart SWF files are present in Download Package > Charts folder.
- XML Data File. FusionWidgets accepts data only in a pre-defined XML format. So, you'll need to convert your data to XML format - either using a server side scripting language or manually.
- HTML Wrapper File. This HTML file would contain the code to embed the chart.
- FusionCharts JavaScript class - This JavaScript class is used to embed the charts inside HTML page. It serves two purpose:
- Allows easy embedding and handling of charts in HTML pages
- Avoids the "Click to activate..." issue in Internet Explorer
Before we get on to assemble the above items, let's create a new folder that will serve as our playground for trials and researches. Create a new folder named as c:\FusionWidgets on your computer. We'll keep all our examples within this folder.
For our first chart example, we'll create another folder within the above folder. Name the new folder as MyFirstChart so that the structure now looks like c:\FusionWidgets\MyFirstChart.
Now, to build the chart, we need to copy chart SWF files within this folder. Before that, create another folder Charts under c:\FusionWidgets, so that the new folder looks like c:\FusionWidgets\Charts. This folder would be our container for all the chart SWF files.
Copy all the chart SWF files (from Download Package > Charts folder) into this newly created folder (c:\FusionWidgets\Charts\).
Also copy FusionCharts.js file (from Download Package > JSClass) into this folder. This JavaScript file contains the class to help us easily embed the charts in our HTML page.
This folder serves as the central location for charts. All our examples would use the charts contained in this single folder.
Now that the SWF files are set up, we move on to see how to create the XML data for our chart.
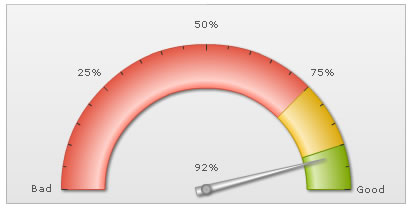
Before we build the chart, we first need to have the data that we'll present on the chart. Since we're plotting customer satisfaction index for a fictional company, let us first define the scales for measuring this index. The scales would look as under in a tabular form:
| Range | What it means? |
Color to be represented in |
| 0-75% | Bad customer satisfaction |
Red |
| 75-90% | Moderate customer satisfaction |
Yellow |
| 90-100% | Good customer satisfaction |
Green |
Let us assume that, as a result of a survey, the company found that 92% of its customers are satisfied with it. So, we need to depict the above scales and this value in our angular gauge.
Now, as mentioned earlier, FusionWidgets necessarily needs its data in pre-defined XML format. It cannot read any other format (including Excel, CSV or text data) apart from XML. So, we need to convert this data into XML.
The converted XML data would look as under:
<colorRange>
<color minValue='0' maxValue='75' code='FF654F'/>
<color minValue='75' maxValue='90' code='F6BD0F'/>
<color minValue='90' maxValue='100' code='8BBA00'/>
</colorRange>
<dials>
<dial value='92' rearExtension='10'/>
</dials>
</chart>
Punch the above code in a text editor (e.g., Notepad) and save it as Data.xml under c:\FusionWidgets\MyFirstChart folder.
And yeah - don't worry about whatever spaghetti stuff you have just written - we'll soon cover them. Basically, what we've done above can be listed in the following points:
- We've created the root <chart> element, with a few attributes to define the lower and upper limit, number suffix, chart color palette, gauge angles etc.
- For each color range (index scale), we've created a <color> element under the <colorRange> element. We've specified its start value, end value and color.
- And we've finally created a dial to represent the value of 92%. This is attained using the <dial> element under the <dials> element. You can point to as many different values as you want using appropriate number of dials.
- We've stripped off the % sign from our figures, as FusionWidgets needs pure numbers without % or $ or commas. The numberSuffix attribute would take care of putting them back again on the chart.
Just as a measure to check if the XML document is structurally valid, open the file in your browser. You should be able to see the XML data document in a formatted way, without any errors.
And now, if you're running out of your patience to see this data in chart
format, let's quickly build the HTML container for this chart.
<html>
<head>
<title>My first chart using FusionWidgets</title>
<script language="JavaScript" src="Charts/FusionCharts.js"></script>
</head>
<body bgcolor="#ffffff">
<div id="chartdiv" align="center">
The chart will appear within this DIV. This text will be replaced by the chart.
</div>
<script type="text/javascript">
var myChart = new FusionCharts("Charts/AngularGauge.swf", "myChartId", "400", "200", "0", "0");
myChart.setDataURL("Data.xml");
myChart.render("chartdiv");
</script>
</body>
</html>
The code in bold above is the actual code that you need to place in your page to embed a FusionCharts chart.
Here, we first include the FusionCharts JavaScript class file using:
Create a DIV in the page body with a unique id (chartdiv in example above).
Instantiate a chart using the following code with width as 400 and height as 200. Also, we've specified the chart's ID as myChartId.
Here, myChart is the name of the JavaScript object that contains reference to our chart.
As parameters, we pass:
- URL of SWF file of the chart type that we intend to use
- Id for the chart - You can give any id for the chart. Just make sure that if you're using multiple charts in the same HTML page, each chart should have a unique Id.
- Required width and height of the chart.
- The last two parameters are debugMode and registerWithJS and are normally set to 0. We'll explain those parameters later
Convey the XML data path to the chart using:
If for some reasons, you do not see a chart similar to one shown above, run through the following checks:
If you see an endless loading progress bar in your browser, or if the right click menu (right click at the place where the chart is supposed to be) shows "Movie not loaded", check the following:
- Have you pasted the chart SWF files in Charts folder?
- Have you provided the SWF path properly in your MyFirstChart.html page?
- Do you have Adobe Flash Player 8 (or above) installed for this browser?
- Have you enabled your browser to show ActiveX controls? Normally, all browsers are Flash-enabled.
If you get a screen showing "The chart will appear within this DIV. This text will be replaced by the chart.", make sure that:
- You've copied FusionCharts.js in Charts folder.
- You've included the proper path to this JS file in your HTML code.
If you get an "Error in Loading Data" message, check the following:
- Whether Data.xml is in the same folder as the Chart.html HTML file?
- Whether Data.xml is named as Data.xml and not Data.xml.txt, as many basic text editors append .txt after the file name?
- If you're using an operating system that uses case sensitive naming for file system, check for the names of your XML and SWF file.
If you get an "Invalid XML Data" message, it means that the XML data document is malformed. Check it again for common errors like:
- Difference in case of tags. <chart> should end with </chart> and not </Chart> or </CHART>
- Missing opening/closing quotation marks for any attributes. e.g., <chart numberSuffix=%' should be <chart numberSuffix='%'
- Missing closing tag for any element.
To check whether your final XML is ok, open it in your browser and you'll see the error.