FusionWidgets and Flash > Loading Multiple Charts
In our previous example, we had seen how to load a single angular gauge in a Flash movie. Here, we'll see how to load two charts in a single Flash Movie.
Loading two (or n charts) in your Flash movie is as simple and straight-forward as loading a single chart. You just need to create instances of each chart class, provide it the right XML data and then ask it to render.
//These two files contain pre-loading functions and application
//messages for the chart.
//Note: If you're loading multiple charts in your Flash movie, you
//do NOT need to include these files for each each. You can put these
//lines in the main timeline, so that it gets loaded only once.
#include "com/fusioncharts/is/includes/LoadingFunctions.as"
#include "com/fusioncharts/is/includes/AppMessages.as"
//To create the chart, you now need to import the Class of the
//chart which you want to create. All charts are present in the package
//com.fusioncharts.is.core.charts (Download Package > SourceCode folder)
//If you're using multiple charts, you can import all the requisite
//chart classes in the main timeline of your movie. That ways, you
//wouldn't have to import the chart classes everytime you wish to use.
import com.fusioncharts.is.core.charts.AngularGauge;
import com.fusioncharts.is.core.charts.CylinderGauge;
// ------------- XML Data for the chart -------------- //
//Data for chart 1
var strXML1:String = "<chart bgColor='FFFFFF' showBorder='0' lowerLimit='0' upperLimit='100' lowerLimitDisplay='Bad' upperLimitDisplay='Good' gaugeStartAngle='180' gaugeEndAngle='0' palette='1' numberSuffix='%' tickValueDistance='20' showValue='1'>";
//Create color range
strXML1 = strXML1 + "<colorRange>";
strXML1 = strXML1 + "<color minValue='0' maxValue='75' code='FF654F'/>";
strXML1 = strXML1 + "<color minValue='75' maxValue='90' code='F6BD0F'/>";
strXML1 = strXML1 + "<color minValue='90' maxValue='100' code='8BBA00'/>";
strXML1 = strXML1 + "</colorRange>";
//Add simple data for demo.
strXML1 = strXML1 + "<dials>";
strXML1 = strXML1 + "<dial value='92' rearExtension='10'/>";
strXML1 = strXML1 + "</dials>";
strXML1 = strXML1 + "</chart>";
var xmlData1:XML = new XML(strXML1);
// Data for Chart 2
var strXML2:String = "<chart showBorder='0' palette='3' lowerLimit='0' upperLimit='4000' numberSuffix=' ltrs.' bgColor='FFFFFF' ticksOnRight='0'> ";
//Add simple data for demo.
strXML2 = strXML2+"<value>2452</value>";
strXML2 = strXML2+"</chart>";
var xmlData2:XML = new XML(strXML2);
// Data for Chart 3
var strXML3:String = "<chart showBorder='0' palette='4' lowerLimit='0' upperLimit='4000' numberSuffix=' ltrs.' bgColor='FFFFFF'> ";
//Add simple data for demo.
strXML3 = strXML3+"<value>1853</value>";
strXML3 = strXML3+"</chart>";
var xmlData3:XML = new XML(strXML3);
// --------------------------------------------------- //
// -------------- Actual Code to create the chart ------------//
//Create movie clips required for the three charts
var chartContainer1MC:MovieClip = this.createEmptyMovieClip("ChartHolder1", 1);
var chartContainer2MC:MovieClip = this.createEmptyMovieClip("ChartHolder2", 2);
var chartContainer3MC:MovieClip = this.createEmptyMovieClip("ChartHolder3", 3);
//Now, instantiate the charts using Constructor function of the chart.
var chart1:AngularGauge = new AngularGauge(chartContainer1MC, 1, 380, 200, 20, 25, false, false, "", "EN", "noScale");
var chart2:CylinderGauge = new CylinderGauge(chartContainer2MC, 1, 190, 200, 20, 260, false, false, "", "EN", "noScale");
var chart3:CylinderGauge = new CylinderGauge(chartContainer3MC, 1, 190, 200, 220, 260, false, false, "", "EN", "noScale");
//Convey the XML data to charts.
chart1.setXMLData(xmlData1);
chart2.setXMLData(xmlData2);
chart3.setXMLData(xmlData3);
//Draw the charts
chart1.render();
chart2.render();
chart3.render();
//Stop
stop();
In the above code, we're:
- First including com/fusioncharts/is/includes/LoadingFunctions.as & com/fusioncharts/is/includes/AppMessages.as - required files for pre-loading chart.
- Thereafter, we import the AngularGauge class and Cylinder Class as we'll be plotting two chart types and three charts in this example.
- We now create XML data for all the charts. In this example, again, we've hard-coded the XML data. You can create the XML data dynamically based on your data sources.
- We convert the XML data into XML Objects.
- We now create three empty movie clips - one for each chart.
- Next, we create instances of each chart and pass the required parameters. We set the x and y offset for each chart, so that the chart draws at the right co-ordinates.
- Moving on, we convey the XML data of each chart using setXMLData method.
- Finally, we draw the charts by calling the render() method for each chart's instance object.
When you now view the application, you'll get the following output. Again, you might need to adjust the FPS of the movie based on your requirements.
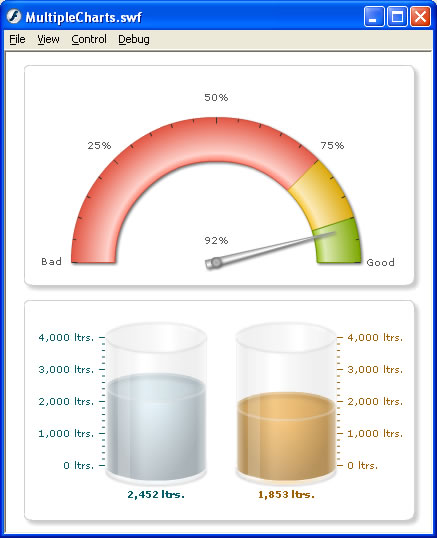
In this example, we've included just the angular and cylinder gauges. You can include any FusionWidgets v3 chart in your application in the same way.
Also, here we've shown just 3 charts together. You can include any number of charts in your application (on a single screen too).
Now that you're fairly convinced of the power of FusionWidgets in conjunction with Flash, let's move ahead and see an example where the chart loads data from an external physical XML data file, instead of building it using string concatenation.