FusionWidgets and Flash > Overview
Starting FusionWidgets v3, the charts can now be very easily integrated with your Flash movies and applications. Unlike previous versions, where you had to load pre-compiled chart SWFs at run-time, you can now include the respective chart's class at design-time and then compile it with your application to form a single comprehensive unit.
To load FusionWidgets v3 in your Flash movies, you need to make sure that your Flash movies are also in Flash 8 format and uses ActionScript 2. This is because FusionWidgets is coded in ActionScript 2/Flash 8 and intensively makes use of features provided in Flash 8.
FusionWidgets always needs its data in XML format. It CANNOT accept any other format of data including variables, arrays, recordsets etc. Even when using FusionWidgets inside your Flash movies, you need to provide it XML data only.
XML data can be easily created in your Flash movies either using string concatenation or using methods of the XML Object. You do not need to store data in physical XML files. You can build the XML data in Flash variables at run-time and then pass this to chart. So, even if you've your data in arrays, recordsets or remote database (that you access using your own Flash code), you can easily convert them to XML at run-time and then use FusionWidgets with it.
We won't be discussing XML data structure here, as that has already been discussed in each chart's XML sheet.
Here, we'll directly jump to see how to create a FusionWidgets chart in your Flash application. We'll start with a very basic single gauge application.
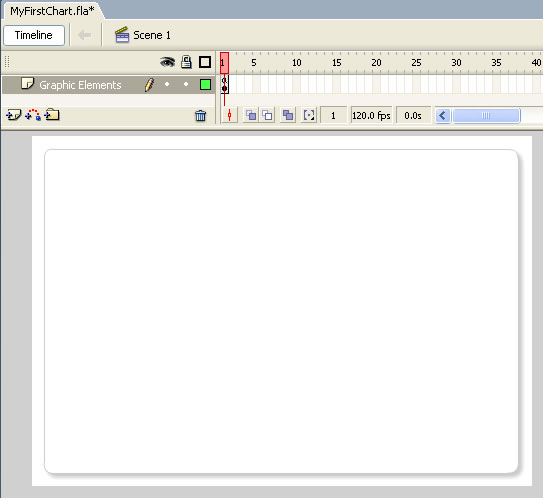
For this example, we create a new .fla named as MyFirstChart.fla. We set the size of this movie to 500x250 pixels and set background as white.
The code examples discussed in this section are present in Download Package > Code > FlashExamples.
Now, before we code to create the charts, we need to set (install) the charts for use in this movie. Setting up the charts for use in your movie is very simple. You just need to copy com folder from Download Package > SourceCode folder into the folder in which you'll be placing your .fla file. Here, we're placing our .fla file in FlashExamples folder, and as such we copy the com folder here.
com folder is the package for FusionWidgets v3 Class files. It contains all the files required to generate any chart in FusionWidgets v3.
Individual chart class files are present in com > fusioncharts > is > core > charts folder. If you feel that you just need to plot a few charts in your movie, you can delete the rest of Chart Class files from this folder.
There are lot of other folders under com > fusioncharts > is folder. These files are required by FusionWidgets to create the chart.
Now that the charts are set for use, let's get back to our Flash file. Rename the default layer as "Graphic Elements" and place an oval shape with shadow effect. Basically, we'll use this as the background of the chart. The idea is to show how easily FusionWidgets can integrate with the graphical elements of your Flash movie. It should look something as under:
/**
* This keyframe contains the Actions required to load a FusionWidgets
* chart in your Flash movie.
*
* We've set the FPS of this movie to 120 for smooth animations.
* Depending on your requirements, you can set any FPS. FusionWidgets
* renders time based animations, so the length of animation would stay
* same. Only the smoothness would vary.
*/
//You first need to include the following two files in your movie.
//These two files contain pre-loading functions and application
//messages for the chart.
//Note: If you're loading multiple charts in your Flash movie, you
//do NOT need to include these files for each each. You can put these
//lines in the main timeline, so that it gets loaded only once.
#include "com/fusioncharts/is/includes/LoadingFunctions.as"
#include "com/fusioncharts/is/includes/AppMessages.as"
//To create the chart, you now need to import the Class of the
//chart which you want to create. All charts are present in the package
//com.fusioncharts.is.core.charts (Download Package > SourceCode folder)
//If you're using multiple charts, you can import all the requisite
//chart classes in the main timeline of your movie. That ways, you
//wouldn't have to import the chart classes everytime you wish to use.
import com.fusioncharts.is.core.charts.AngularGauge;
// ------------- XML Data for the chart -------------- //
//FusionWidgets necessarily needs its data in XML format.
//So, if you've data in arrays, forms, recordsets, etc., you
//first need to convert it into XML. Only then would you be able
//to use the charts.
//Here, we're hard-coding an XML data document for demo.
//In your applications, this XML data could be dynamically
//built at run time using string concatenation or XML
//Object.
//Generate the XML data.
var strXML:String = "<chart bgColor='FFFFFF' showBorder='0' lowerLimit='0' upperLimit='100' lowerLimitDisplay='Bad' upperLimitDisplay='Good' gaugeStartAngle='180' gaugeEndAngle='0' palette='1' numberSuffix='%' tickValueDistance='20' showValue='1'>";
//Create color range XML
strXML = strXML + "<colorRange>";
strXML = strXML + "<color minValue='0' maxValue='75' code='FF654F'/>";
strXML = strXML + "<color minValue='75' maxValue='90' code='F6BD0F'/>";
strXML = strXML + "<color minValue='90' maxValue='100' code='8BBA00'/>";
strXML = strXML + "</colorRange>";
//Add simple data for demo.
strXML = strXML + "<dials>";
strXML = strXML + "<dial value='92' rearExtension='10'/>";
strXML = strXML + "</dials>";
strXML = strXML + "</chart>";
//FusionWidgets chart classes accept XML data as XML Object
//and not XML String.
//So, if you've an XML string, first create an XML object from it
//and then pass to the chart. We do the same.
var xmlData:XML = new XML(strXML);
// --------------------------------------------------- //
// -------------- Actual Code to create the chart ------------//
//To create a chart, you first need to create an empty movie clip to act as chart holder.
var chartContainerMC:MovieClip = this.createEmptyMovieClip("ChartHolder",1);
//Now, instantiate the chart using Constructor function of the chart.
/**
* @param targetMC Movie clip reference in which
* the chart will create its own movie clip.s
* @param depth Depth inside parent movie clip in which
* the chart will create its own movie clips.
* @param width Width of chart
* @param height Height of chart
* @param x x Position of chart
* @param y y Position of chart
* @param debugMode Boolean value indicating whether the chart
* is in debug mode.
* @param registerWithJS Whether to register the chart with JavaScript.
* Set this as false.
* @param DOMId DOM Id of the chart, when interacting with JavaScript. Set as empty.
* @param lang 2 Letter ISO code for the language of application
* messages. Depends on what data you've fed.
* @param scaleMode Scale mode of the movie - noScale or exactFit
*/
var myFirstChart:AngularGauge = new AngularGauge(chartContainerMC, 1, 450, 220, 20, 15, false, false, "", "EN", "noScale");
//Convey the XML data to chart.
myFirstChart.setXMLData(xmlData);
//Draw the chart
myFirstChart.render();
//Stop
stop();
Let's get to the above code step by step. To include any FusionWidgets chart in your Flash movie, you first need to include two files in your movie: com/fusioncharts/is/includes/LoadingFunctions.as and com/fusioncharts/is/includes/AppMessages.as. These files contain necessary pre-load functions and application messages for the chart. In your application, you can put this code in the main timeline, so that it gets executed only once.
After this, we include the Chart Class file of the chart which we intend to plot. All Chart Classes are present in com > fusioncharts > is > core > charts folder. So, the package name of each chart class is com.fusioncharts.is.core.charts. Here, we're building a basic angular gauge, and as such the fully qualified class name is com.fusioncharts.is.core.charts.AngularGauge.
Once the classes are imported, we set our focus to building the XML data for the chart. In this example, we're using an angular gauge. So, the XML structure has to be that of angular gauge. We build the XML using string concatenation in the variable strXML. Here, we're hard-coding the XML data in this string variable. In your real world application, this data could come from a database, web service, recordset etc. All you would need to do is get the appropriate data and then encode it into XML using string concatenation or XML Object (though string concatenation is far easier to use and understand). Finally, we create an XML Object from this xml string, as FusionWidgets accepts only XML Objects.
Moving on , let's see how to build the chart now. Each FusionWidgets chart needs an empty movie clip to build itself in. So, we create an empty movie clip named as ChartHolder. We store the reference to this movie clip in chartContainerMC variable. For demonstration purposes, we've created this empty movie clip in _level0 at depth 1. In your applications, you can create it nested within any movie clip.
var chartContainerMC:MovieClip = this.createEmptyMovieClip("ChartHolder",1);
After that, we come to the main line of code - the line that instantiates the chart object.
var myFirstChart:AngularGauge = new AngularGauge(chartContainerMC, 1, 450, 220, 20, 15, false, false, "", "EN", "noScale");
Here, we're creating an instance of AngularGauge class in our local variable myFirstChart. myFirstChart now stores the reference of the angular gauge that we intend to display in this movie. To the constructor function of the chart class, we pass the following parameters (in sequential order):
| Parameter | Description |
| targetMC | Reference to the movie clip in which the chart will create its sub-movie clips. In our example above, we're creating ChartHolder movie clip for the chart. So, we pass its reference chartContainerMC to the chart. Whenever you're passing a movie clip reference to chart, make sure it's an empty movie clip. |
| depth | The depth inside the targetMC (previous parameter) where you want the chart to start drawing it's elements. You can normally pass 1 as this parameter. |
| width | Intended width of chart in pixels. If you're using "exactFit" as scaleMode, this attribute represents percentage. |
| height | Intended height of chart in pixels. If you're using "exactFit" as scaleMode, this attribute represents percentage. |
| x | x-offset for the chart inside targetMC movie clip. This effectively asks the chart to leave x pixels on left inside targetMC movieclip before it starts drawing. In our example, we've set it to 20, as we've our oval background element border extending till 20 pixels on left. |
| y | y-offset for the chart inside targetMC movie clip. This effectively asks the chart to leave y pixels on top inside targetMC movieclip before it starts drawing. In our example, we've set it to 15, as we've our oval background element border extending till 15 pixels on top. |
| debugMode | This takes a boolean value indicating whether to start the chart in debug mode or not. Please see Debugging your Charts > Debug Window section for more information on this. |
| registerWithJS | Not required when loading in Flash. So, always set it to false. |
| DOMId | Not required when loading in Flash. So, always set it as "" |
| lang | 2 Letter ISO code for the language of application messages. It depends on what data you've fed for Application Messages. By default, only English messages are fed into the system and the ISO code is "EN". |
| scaleMode | Scale mode of the movie - noScale or exactFit. noScale is the recommended method for FusionWidgets, as that scales the chart in pixels. exactFit method basically re-scales the entire chart instead of re-drawing. |
Note that the above parameters are same for all FusionWidgets chart.
This completes the initialization of your chart. You now need to convey the XML data to chart. To do so, you use the setXMLData() method of Chart Class as under:
myFirstChart.setXMLData(xmlData);
Here, xmlData refers to our XML Object which we had earlier created. Finally, you render the chart by calling render() method of the chart object:
myFirstChart.render();
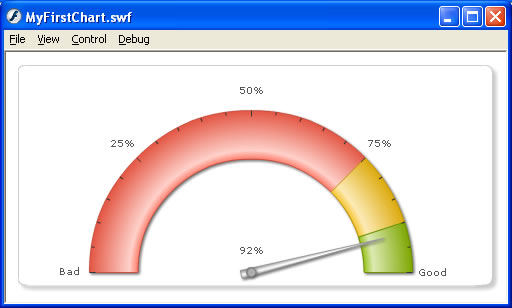
When you now view this application, you'll get the following results.
If you run this app, you'll see that the animations are a bit jerky. This is because your movie's default FPS (frames per seconds) is set to 12. FusionWidgets uses time based animations as as such it still completes the same animation path using 12 FPS, which results in the jerkiness. So, to make the animations smooth, you can increase the FPS depending on your application's requirements.
Easy - isn't it? Well, this was just a beginning. You'll soon see how easy it is to embed powerful charting capabilities in your Flash applications now. We next see how to load multiple charts in the same application.