Funnel Chart > Introduction
Funnel charts are basically used to plot streamlined data, e.g. plotting sales data for sales pipeline analysis. A funnel chart consists of various segments, each representing a data set.
FusionWidgets funnel chart allows you to plot 2 types of funnel chart:
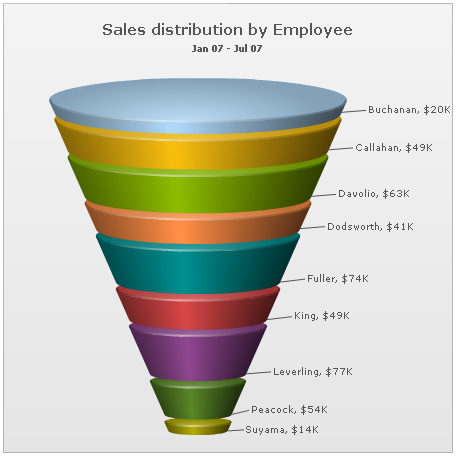
- Streamline funnel chart - In this chart, the data is stream-lined, i.e., each funnel slice in the funnel represents a process flow that has filtered out data. For e.g., if you were using a funnel chart to display the employment process, you can show the first funnel slice as "Number of candidates applied". Thereafter, each process flow (like "Interview Phase 1", "IQ Test", "Project" etc.) represents a funnel slice and filters out the data provided for first funnel. The last funnel bears the value that is the final result of the entire procedure (for e.g., "Candidates recruited" in this example)
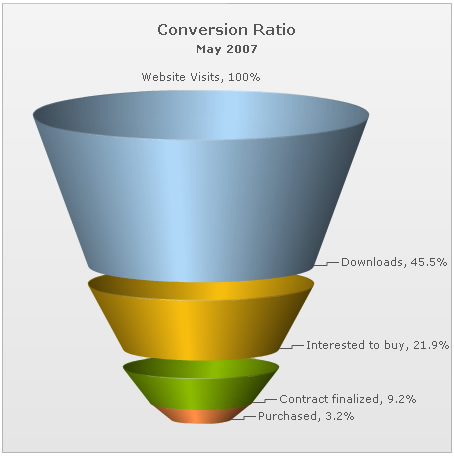
- Section funnel chart - This type of funnel Chart displays data that equals 100% when totalled. In this chart, there is no streamlining of data. The height of each funnel segment with respect to the entire funnel height depicts the value for that particular data set. So, basically it's similar to a pie chart in funnel shape.
Shown below are examples of both type of chart:
FusionWidgets funnel chart offers you a lot of features like:
- Ability to draw the same data as either streamlined funnel chart or as section funnel chart.
- Interactive funnel slices, when clicked can separate from the main funnel.
- Option to plot funnel slices as hollow or filled.
- Option to set same slant angle for each funnel slice (or make them dependent on data).
- Ability to seamlessly convert 3D funnel to 2D funnel, by right clicking on chart and selecting View 2D.
- Option to render the funnel in 2D mode itself with more control over border and fill properties.
- Option to show values as actual values or in percentage.
- If shown as percentage, you can opt to show it as percentage of the first value or percentage of previous value.
- Smart labels to avoid overlapping of funnel labels.
- Option to place labels at side or at center.
- Custom tool text for each funnel slice.
- Links supported for each funnel slice.