Gantt Chart > Creating Milestones
Milestones are an important part of the Gantt chart as they allow you to visually depict any crucial dates on the chart. FusionWidgets allows you to create your own milestones on the chart based on date and task i.e., for a given task you can specify milestones on specific dates, and you can customize all the visual properties of the milestone including shape (star or polygon), size and colors.
Additionally, you can add tool text and link for the milestone. Here, we'll see how to do the same.
FusionWidgets allows you to create a milestone based on each task i.e., you can create milestone for each task at the specified date. As such, to create a milestone, you need to have the following ready:
- The task ID to which this milestone relates to. You'll need to define all the tasks on your chart with a task ID.
- Date of milestone
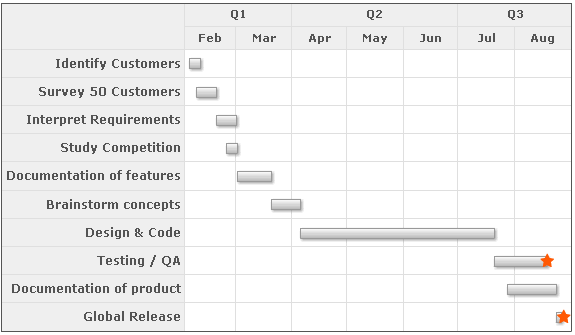
Let's quickly see an example where we add a milestone to one of our previous charts - "Gantt Project Schedule". We'll show two milestones - one to represent Development complete and another one to show Successful global release. The end chart would look as under:

<categories>
<category start='02/01/2007' end='04/01/2007' label='Q1' />
<category start='04/01/2007' end='07/01/2007' label='Q2' />
<category start='07/01/2007' end='09/01/2007' label='Q3' />
</categories>
<categories>
<category start='02/01/2007' end='03/01/2007' label='Feb' />
<category start='03/01/2007' end='04/01/2007' label='Mar' />
<category start='04/01/2007' end='05/01/2007' label='Apr' />
<category start='05/01/2007' end='06/01/2007' label='May' />
<category start='06/01/2007' end='07/01/2007' label='Jun' />
<category start='07/01/2007' end='08/01/2007' label='Jul' />
<category start='08/01/2007' end='09/01/2007' label='Aug' />
</categories>
<processes fontSize='12' isBold='1' align='right'>
<process label='Identify Customers' />
<process label='Survey 50 Customers' />
<process label='Interpret Requirements' />
<process label='Study Competition' />
<process label='Documentation of features' />
<process label='Brainstorm concepts' />
<process label='Design & Code' />
<process label='Testing / QA' />
<process label='Documentation of product' />
<process label='Global Release' />
</processes>
<tasks>
<task start='02/04/2007' end='02/10/2007' id='TSKIDC' />
<task start='02/08/2007' end='02/19/2007' id='TSKSRC' />
<task start='02/19/2007' end='03/02/2007' id='TSKINR' />
<task start='02/24/2007' end='03/02/2007' id='TSKSTC' />
<task start='03/02/2007' end='03/21/2007' id='TSKDOC' />
<task start='03/21/2007' end='04/06/2007' id='TSKBRS' />
<task start='04/06/2007' end='07/21/2007' id='TSKDSC' />
<task start='07/21/2007' end='08/19/2007' id='TSKTQA' />
<task start='07/28/2007' end='08/24/2007' id='TSKDCP' />
<task start='08/24/2007' end='08/27/2007' id='TSKREL' />
</tasks>
<milestones>
<milestone date='8/19/2007' taskId='TSKTQA' shape='star' toolText='Development Complete' color='FF5904'/>
<milestone date='8/28/2007' taskId='TSKREL' shape='star' toolText='Successful Global Release' color='FF5904'/>
</milestones>
</chart>
As you can see above, we've:
- Specified a task ID for each task. It is using this ID that milestones are related to tasks.
- Created <milestones> element to contain all milestones for the chart.
- Created a <milestone> element with lot of properties to indicate each milestone.
- TaskId refers to the ID of task to which milestone gets attached to
- date refers to the date of the milestone
- shape can be star or polygon. You've more customizable properties for the milestone, which have been listed in XML Sheet.
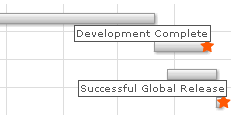
- We've also defined our custom tool text for each milestone, which the user gets to see if he moves his mouse over the milestone.
- We've defined our own color for each milestone.
- You can also link each milestone by setting <milestone link='link in FusionCharts format' ..>
The tool tips show up as under:
