Gantt Chart > Multi-tasked processes
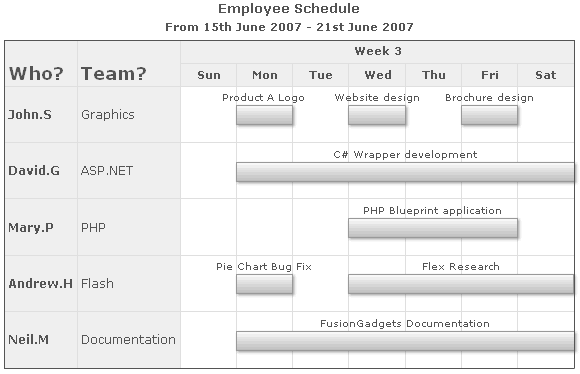
In all our previous examples, we've seen how to allot one task for each process. However, in real life scenarios, you can have multiple tasks allotted for each process. For example, consider a Gantt chart showing "Employee Schedule" with each employee as a process. There, you might have to need to create multiple tasks for each employee. FusionWidgets Gantt chart allows you to do so by mapping tasks and processes using IDs. Here, we'll see an example of that.
| Employee Name | Employee ID | Which team? | Alloted tasks for this week | ||||||||
| John.S | EMP121 | Graphics |
|
||||||||
| David.G | EMP122 | ASP.NET |
|
||||||||
| Mary.P | EMP123 | PHP |
|
||||||||
| Andrew.H | EMP124 | Flash |
|
||||||||
| Neil.M | EMP125 | Documentation |
|
As you can see above, we're:
- Going to use employee as a process for the Gantt chart.
- We've assigned an employee Id to each employee. We'll be using this in our XML. It is this ID which will be used to map the tasks with employees.
- Defined multiple tasks for employees.
- Additionally, we've given a task ID to each task (not shown in the table above).
When you dynamically generate the Gantt chart's XML data from your database, in all probability you'll have internal IDs defined for each task and each process. You can use that IDs as the process ID and task ID.
<categories>
<category start='15/07/2007' end='22/07/2007' label='Week 3' />
</categories>
<categories>
<category start='15/07/2007' end='16/07/2007' label='Sun' />
<category start='16/07/2007' end='17/07/2007' label='Mon' />
<category start='17/07/2007' end='18/07/2007' label='Tue' />
<category start='18/07/2007' end='19/07/2007' label='Wed' />
<category start='19/07/2007' end='20/07/2007' label='Thu' />
<category start='20/07/2007' end='21/07/2007' label='Fri' />
<category start='21/07/2007' end='22/07/2007' label='Sat' />
</categories>
<processes fontSize='12' isBold='1' align='left' headerText='Who?' headerFontSize='18' headerVAlign='bottom' headerAlign='left'>
<process label='John.S' id='EMP121'/>
<process label='David.G' id='EMP122'/>
<process label='Mary.P' id='EMP123'/>
<process label='Andrew.H' id='EMP124'/>
<process label='Neil.M' id='EMP125'/>
</processes>
<datatable headerVAlign='bottom'>
<datacolumn headerText='Team?' headerFontSize='18' headerVAlign='bottom' headerAlign='left' align='left' fontSize='12' >
<text label='Graphics' />
<text label='ASP.NET' />
<text label='PHP' />
<text label='Flash' />
<text label='Documentation' />
</datacolumn>
</datatable>
<tasks showLabels='1'>
<task processId='EMP121' id='TSK1311' start='16/07/2007' end='17/07/2007' label='Product A Logo'/>
<task processId='EMP121' id='TSK1325' start='18/07/2007' end='19/07/2007' label='Website design'/>
<task processId='EMP121' id='TSK1329' start='20/07/2007' end='21/07/2007' label='Brochure design'/>
<task processId='EMP122' id='TSK1393' start='16/07/2007' end='22/07/2007' label='C# Wrapper development'/>
<task processId='EMP123' id='TSK1398' start='18/07/2007' end='21/07/2007' label='PHP Blueprint application'/>
<task processId='EMP124' id='TSK1498' start='16/07/2007' end='17/07/2007' label='Pie Chart Bug Fix'/>
<task processId='EMP124' id='TSK1499' start='18/07/2007' end='22/07/2007' label='Flex Research'/>
<task processId='EMP125' id='TSK1512' start='16/07/2007' end='22/07/2007' label='FusionWidgets Documentation'/>
</tasks>
</chart>
In the above XML, we've:
- Defined the visual timeline (categories) to show days in 3rd week of July 2007.
- Defined each employee as a process and assigned the employee ID as process ID
- Added each employee's team name as additional data column
- Defined each task with it's own ID. Each task is linked to its employee using the process ID.
When you now view this chart, you'll get something as under:


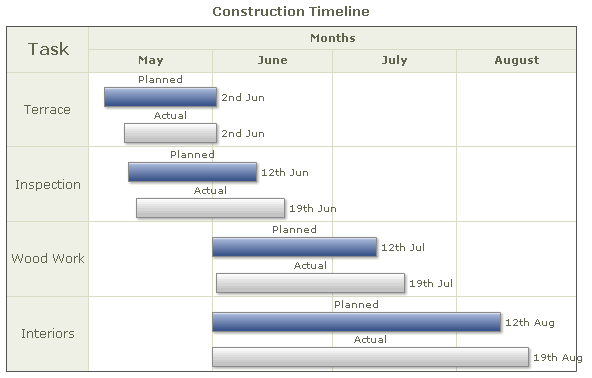
In the above chart, we're showing the time required by various tasks in a construction process. We've shown the projected time required in blue and actual time required in a shade of grey.
This was done using the following XML:
<categories>
<category start='1/5/2008' end='31/8/2008' label='Months' />
</categories>
<categories>
<category start='1/5/2008' end='31/5/2008' label='May' />
<category start='1/6/2008' end='30/6/2008' label='June' />
<category start='1/7/2008' end='31/7/2008' label='July' />
<category start='1/8/2008' end='31/8/2008' label='August' />
</categories>
<processes headerText='Task' headerFontSize='16' fontSize='12'>
<process label='Terrace' id='TRC' />
<process label='Inspection' id='INS' />
<process label='Wood Work' id='WDW' />
<process label='Interiors' id='INT' />
</processes>
<tasks showLabels='1' showEndDate='1'>
<task label='Planned' processId='TRC' start='5/5/2008' end='2/6/2008' id='5-1' color='4567aa' height='25%' topPadding='22%' />
<task label='Actual' processId='TRC' start='10/5/2008' end='2/6/2008' id='5' color='EEEEEE' height='25%' topPadding='70%'/>
<task label='Planned' processId='INS' start='11/5/2008' end='12/6/2008' id='6-1' color='4567aa' height='25%' topPadding='22%' />
<task label='Actual' processId='INS' start='13/5/2008' end='19/6/2008' id='6' color='EEEEEE' height='25%' topPadding='70%'/>
<task label='Planned' processId='WDW' start='1/6/2008' end='12/7/2008' id='7-1' color='4567aa' height='25%' topPadding='22%' />
<task label='Actual' processId='WDW' start='2/6/2008' end='19/7/2008' id='7' color='EEEEEE' height='25%' topPadding='70%'/>
<task label='Planned' processId='INT' start='1/6/2008' end='12/8/2008' id='8-1' color='4567aa' height='25%' topPadding='22%' />
<task label='Actual' processId='INT' start='1/6/2008' end='19/8/2008' Id='8' color='EEEEEE' height='25%' topPadding='70%' />
</tasks>
</chart>
To achieve this, we've done the following:
- Defined each construction task as a process with its unique ID
- Defined the estimated time required for each task with its own ID and the mapped process ID. Also, we've set the topPadding of this task bar to 22% and height as 25%
- Defined the actual time required for each task with its own ID and the mapped process ID. For this task, we've set topPadding as 70% (to show below the estimated time bar) and height as 25%