In this section, we'll see how to update the chart by providing it the new URL for XML Data. Using this method, we just provide the URL of the XML data document to chart. It then becomes the job of the chart to request data from that URL, parse it and finally render it.
Code examples discussed in this section are present in Download Package > Code > JavaScript folder.
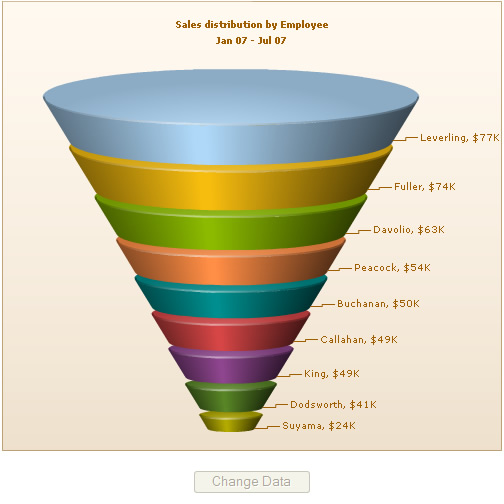
To show an example of this, we've created a physical XML data file named as NewData.xml, which contains the following code:
<set label='Buchanan' value='50000' />
<set label='Callahan' value='49000' />
<set label='Davolio' value='63000' />
<set label='Dodsworth' value='41000' />
<set label='Fuller' value='74000' />
<set label='King' value='49000' />
<set label='Leverling' value='77000' />
<set label='Peacock' value='54000' />
<set label='Suyama' value='24000' />
</chart>
We'll now create an HTML page ChangeDataURL.html, which will use the setDataURL() method of chart to make the chart read new data from the above XML file. It contains the following code:
<HEAD>
<TITLE>FusionWidgets & JavaScript - Updating chart using setDataURL() Method</TITLE>
<SCRIPT LANGUAGE="Javascript" SRC="../Charts/FusionCharts.js"></SCRIPT>
<SCRIPT LANGUAGE="JavaScript">
//updateChart method is called whenever the user clicks the button to
//update the chart. Here, we get a reference to the chart and update it's
//data using setDataURL method.
function updateChart(DOMId){
//Get reference to chart object using Dom ID
var chartObj = getChartFromId("chart1Id");
//Update it's URL
chartObj.setDataURL("NewData.xml");
//Disable the button
this.document.frmUpdate.btnUpdate.disabled = true;
}
</SCRIPT>
</HEAD>
<BODY>
<div id="chart1div">
FusionWidgets
</div>
<script language="JavaScript">
var chart1 = new FusionCharts("../Charts/Funnel.swf", "chart1Id", "500", "450", "0", "1");
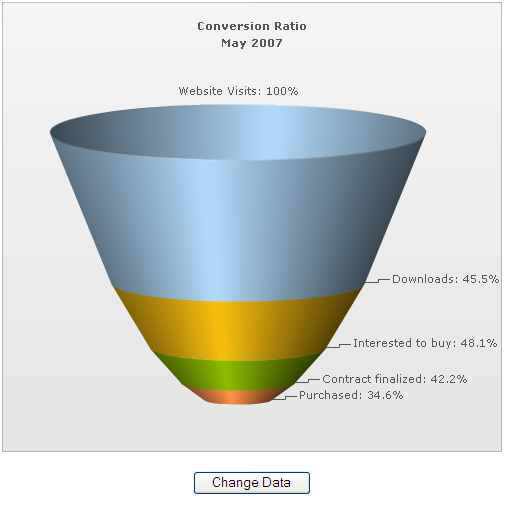
chart1.setDataXML("<chart caption='Conversion Ratio' subcaption='May 2007' showPercentValues='1' decimals='1' baseFontSize='11' percentOfPrevious='1' showPlotBorder='1' funnelYScale='15' labelSepChar=': '><set label='Website Visits' value='385634' /><set label='Downloads' value='175631' /><set label='Interested to buy' value='84564' /><set label='Contract finalized' value='35654' /><set label='Purchased' value='12342' /></chart>");
chart1.render("chart1div");
</script>
<form name='frmUpdate'>
<input type='button' value='Change Data' onClick='javaScript:updateChart();' name='btnUpdate'>
</form>
</BODY>
</HTML>
In the above code, we're first creating a Funnel chart with DOM Id as chart1Id. We also register it with JavaScript. We initially provide the following data to the chart and ask it to render:
<chart caption='Conversion Ratio' subcaption='May 2007' showPercentValues='1' decimals='1' baseFontSize='11' percentOfPrevious='1' showPlotBorder='1' funnelYScale='15' labelSepChar=': '>
<set label='Website Visits' value='385634' />
<set label='Downloads' value='175631' />
<set label='Interested to buy' value='84564' />
<set label='Contract finalized' value='35654' />
<set label='Purchased' value='12342' />
</chart>
Thereafter, we're creating a button, which when clicked would update the chart with new XML data. The button calls the updateChart() JavaScript function when clicked.
The updateChart() JavaScript function has the following code to update the chart:
//Get reference to chart object using Dom ID
var chartObj = getChartFromId("chart1Id");
//Update it's URL
chartObj.setDataURL("NewData.xml");
//Disable the button
this.document.frmUpdate.btnUpdate.disabled = true;
}
Here, we first get a reference to the chart using its DOM Id. We use the getChartFromId() JavaScript function to get the reference.
If you've your chart objects inside <FORM> elements, you CANNOT use getChartFromId() method to get a reference to the chart, as the DOM Hierarchy of the chart object has changed. You'll get a JavaScript "<<ChartId>> is undefined" error. In these cases, you'll manually need to get a reference to the chart object. Or, you can opt to place the chart object outside <FORM> element.
Once we've got the reference, we simply call setDataURL method and pass the URL of XML data document to this function. This method forces the chart to load the new data, read it and then redraw accordingly. Finally, we disable the button, as it has already been clicked once.
When you now view this page, you'll first see a Funnel Chart as under:
The entire thing happens at client side, without any page refreshes.