Linear Gauge > Edit Mode
The linear gauge in FusionWidgets v3 suite can also act as an input control, allowing users to visually drag & change the value of pointer. Once the value is updated, it can be retrieved from the chart using client side JavaScript.
Here, we'll see how to do the same.
First, we need to register the chart with JavaScript by setting registerWithJS flag to 1, as under. This is required because we'll need to retrieve the chart's update value using JavaScript.
(Note the last parameter set as 1)
Next, we need to tell the chart to switch the edit mode on. This can be done either at the global level using:
<chart ... editMode='1' ..>
This makes all the pointers present on the chart editable.
Or, you can make individual pointer editable using:
<pointer ... editMode='1' ..>
This enables the particular pointer to be editable. The user can now drag that pointer to change its value.
Once the user has changed the value of the gauge, the chart automatically calls FC_ChartUpdated(DOMId) JavaScript function.
You'll have to define this method in your HTML page and then write JavaScript code to retrieve the data using getData(index) or getDataForId(id) method. Let's quickly see an example.
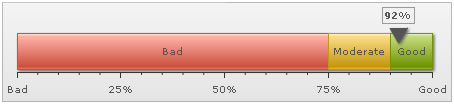
We'll build a simple example to let the user choose his satisfaction % using a linear gauge chart. Once he has selected the value, we'll simply display it within the HTML page.
In your real-life application, you could use the return value to assign to a hidden form field and then submit the form to server side scripts for processing.
The chart will use the following XML:
<colorRange>
<color minValue='0' maxValue='75' code='FF654F' label='Bad'/>
<color minValue='75' maxValue='90' code='F6BD0F' label='Moderate'/>
<color minValue='90' maxValue='100' code='8BBA00' label='Good'/>
</colorRange>
<pointers>
<pointer value='92' />
</pointers>
<styles>
<definition>
<style type='font' name='myValueFont' bgColor='F1f1f1' borderColor='999999' />
</definition>
<application>
<apply toObject='Value' styles='myValueFont' />
</application>
</styles>
</chart>
Let's now look at the HTML + JavaScript code required to retrieve data from this pointer when user changes the value. We create an HTML page with the following code.
This page is present in Download Package > Code > LinearGauge > EditMode.html
<HEAD>
<TITLE>FusionWidgets v3 - Edit Mode</TITLE>
<script type="text/javascript" src="../Charts/FusionCharts.js"></script>
<script language="javascript">
//FC_ChartUpdated method is called when user has changed pointer value.
function FC_ChartUpdated(DOMId){
//Check if DOMId is that of the chart we want
if (DOMId=="ChId1"){
//Get reference to the chart
var chartRef = getChartFromId(DOMId);
//Get the current value
var pointerValue = chartRef.getData(1);
//You can also use getDataForId method as commented below, to get the pointer value.
//var pointerValue = chartRef.getDataForId("CS");
//Update display
var divToUpdate = document.getElementById("contentDiv");
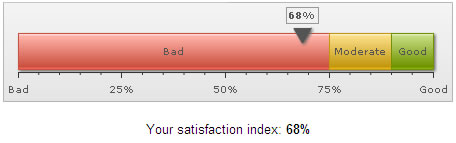
divToUpdate.innerHTML = "<span class='text'>Your satisfaction index: <B>" + Math.round(pointerValue) + "%</B></span>";
}
}
</script>
<style type="text/css">
.text{
font-family:Arial, Helvetica, sans-serif;
font-size:10pt;
}
</style>
</HEAD>
<BODY>
<CENTER>
<div id="chart1div">
This text is replaced by the Flash movie.
</div>
<script type="text/javascript">
var chart1 = new FusionCharts("../Charts/HLinearGauge.swf", "ChId1", "450", "100", "0", "1");
chart1.setDataURL("EditMode.xml");
chart1.render("chart1div");
</script>
<BR>
<DIV id="contentDiv">
<span class='text'>Please drag the pointer above to indicate your satisfaction index.
</DIV>
</BR>
</BODY>
</HTML>
Here, we're:
- Creating a linear gauge with registerWithJS flag set as 1. This enables the chart to communicate with JavaScript.
- We initialize the chart with data provided by EditMode.xml (containing the data listed above).
- The chart now renders in edit mode and the pointer can be dragged to any value.
- Whenever the pointer value is now changed, the chart calls FC_ChartUpdated(DOMId) JavaScript function.
- In this function, we first check if the event was raised by our chart. We do so by matching the DOM Id of the chart.
- If the DOM Id matches, we retrieve the new data of chart using getData(pointerIndex) method. This method returns the numeric value of a particular pointer based on its pointer index. The first pointer on the chart bears an index of 1, second 2 and so on.
- We finally change the content of the contentDiv to show this value (for demo purpose).
When you run this example, you'll get the following result (after changing pointer value):
Instead of getData(index) method, you can also use getDataForId(pointerId) method to retrieve pointer's value as under:
var pointerValue = chartRef.getDataForId("CS");
Here, CS was the pointer ID we had specified in XML.
So, you just saw how easy it is to create editable linear gauges using FusionWidgets.