Creating your First Chart > Multiple Charts in a single page
Using FusionWidgets, you can embed any number of charts in the same HTML page. The process of embedding multiple charts is similar to that of embedding a single chart. You just need to take care of the following:
- Each chart on the page should reference a different DIV to render.
- Each chart on the page should have a different ID (specified in the JavaScript container)
- Each chart has it's own JavaScript variable name (e.g., var chart1 = new FusionCharts(...); var chart2 = new FusionCharts(...); )
Shown below is an example page containing multiple charts. The page is named as MultiChart.html and is stored in MyFirstChart folder itself.
<html>
<head>
<script language="JavaScript" src="../Charts/FusionCharts.js"></script>
</head>
<body bgcolor="#ffffff">
<div id="chart1div" align="center">
The chart will appear within this DIV. This text will be replaced by the chart.
</div>
<script type="text/javascript">
var myChart1 = new FusionCharts("../Charts/AngularGauge.swf", "myChart1Id", "400", "200", "0", "0");
myChart1.setDataURL("Data.xml");
myChart1.render("chart1div");
</script>
<div id="chart2div" align="center">
The chart will appear within this DIV. This text will be replaced by the chart.
</div>
<script type="text/javascript">
var myChart2 = new FusionCharts("../Charts/HLinearGauge.swf", "myChart2Id", "400", "100", "0", "0");
myChart2.setDataURL("CostPerDownload.xml");
myChart2.render("chart2div");
</script>
<div id="chart3div" align="center">
The chart will appear within this DIV. This text will be replaced by the chart.
</div>
<script type="text/javascript">
var myChart3 = new FusionCharts("../Charts/HBullet.swf", "myChart3Id", "400", "60", "0", "0");
myChart3.setDataURL("ProfitPerSale.xml");
myChart3.render("chart3div");
</script>
</body>
</html>
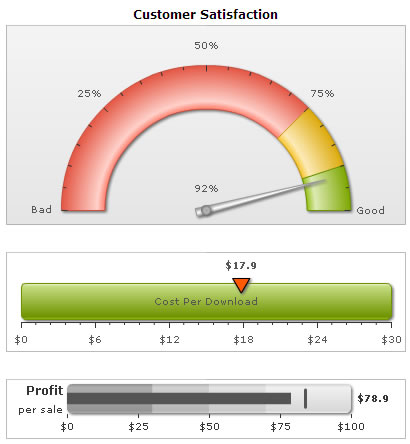
As you can see here, we've embedded three charts in the page:
- AngularGauge.swf with chart ID as myChart1Id, div ID as chart1div and chart variable as myChart1
- HLinearGauge.swf with chart ID as myChart2Id, div ID as chart2div and chart variable as myChart2
- HBullet.swf with chart ID as myChart3Id, div ID as chart3div and chart variable as myChart3
We've also built 2 new XMLs for the linear gauge and bullet graph. We've not shown them here, as we'll covering them in the XML structure of the respective charts.
When you finally view the HTML page (with some formatting applied to above code), you'll get a result as shown under: