Styles > Font Style Type
Attribute |
Brief Description |
Sample or Valid values |
font |
Sets the font family for the text. |
Verdana, Arial .. |
size |
Specifies the font size |
10, 12 .. |
Color |
Sets the font color, should be hex color code without # |
FF0000, FFFFDD |
Bold |
Flag indicating whether font should be bold or not |
1 for Yes, 0 for No |
Italic |
Flag indicating whether font should be italics or not |
1 for Yes, 0 for No |
Underline |
Flag indicating whether font should be underlined |
1 for Yes, 0 for No |
bgColor |
Sets the background color for a text box, should be hex color code without # |
FF0000, FFFFDD |
borderColor |
If you need a border around your text, you can use this parameter |
|
isHTML |
Helps you set whether the text should be rendered as HTML or plain text. |
|
leftMargin |
The left margin of the text, in points |
|
letterSpacing |
The amount of space that is uniformly distributed between characters of the text |
|
Font family, size & color
e.g.,
<style name='MyFirstFontStyle' type='font' font='Verdana' size='12' color='FF0000' />
Attribute |
Format |
Example |
Font |
font='fontfamily' |
font='Verdana' |
Size |
size='fontsize' |
size='12' |
Color |
color='HexCode (without #)' |
color='FF0000' |
Here, font should refer to a fontfamily which is present on the end users system (else the default system font would be used to draw text). Color should be in Hex code without any #.
bold, italic & underline
<style name='MyFirstFontStyle' type='font' font='Verdana' size='12' color='FF0000' bold='1' italic='1' underline='1' />
Attribute |
Format |
Example |
Bold |
bold='Logicalvalue' |
bold='1' or bold='0' |
Italic |
italic='Logicalvalue' |
italic='1' italic='0' |
Underline |
underline='Logicalvalue' |
underline='1' or underline='0' |
The above code will make sure that your font appears as bold, italicized and underlined.
bgColor
and borderColor
<style name='MyFirstFontStyle' type='font' font='Verdana' size='12' color='FF0000' bgColor='FFFFDD' borderColor='666666' />
Attribute |
Format |
Example |
bgColor |
bgColor='value' |
bgColor='FFFFDD' |
borderColor |
borderColor='value ' |
borderColor='666666' |
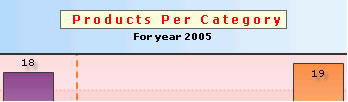
 |
Chart caption ("Products Per Category") with border and background color applied to it. |
isHTML
This attribute is particularly useful, when you have HTML characters as a part of your text e.g., "< 5" or "> 5" etc. By default, FusionCharts renders all text as HTML and as such "< 5" will be treated as a non-closing HTML tag and wouldn't be displayed at all.
For example, if you've to display
"< 5" for a particular set value, you would use:
<set name='< 5' value='7' />
(Note that < is the encoded form
of <, which is used in XML
data documents).
<style name='LabelFont' type='font' font='Arial' size='10' isHTML='0' />
Attribute |
Format |
Example |
isHTML |
isHTML ='Logicalvalue' |
isHTML ='1' or isHTML ='0' |
leftMargin and letterSpacing
leftMargin lets you set the left margin of the text (in points) and letterSpacing allows you to control the space that is uniformly distributed between characters - the value specifies the number of pixels that are added to the space after each character. A negative value condenses the space between characters.
<style name='MyFirstFontStyle' type='font' font='Verdana' size='12' color='FF0000' bgColor='FFFFDD' borderColor='666666' leftMargin='10' letterSpacing='3'/>
Attribute |
Format |
Example |
leftMargin |
leftMargin='value in pixels' |
leftMargin='10' |
letterSpacing |
letterSpacing='value in pixels' |
letterSpacing='3' |
The above style when applied to chart caption, gives the following output:
 |