Thermometer Gauge > Creating a simple gauge
As an example for thermometer gauge, we will plot the temperature of Antarctica. The final result would look something as under:
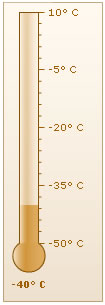
The various steps involved in creating this thermometer chart are:
- Defining the lower and upper limits for the gauge, i.e. the starting and the ending values respectively to be plotted on the gauge: -50 and 10 in this case.
- Passing the value to be displayed to the chart, -40° C for Antarctica . This value is displayed in the chart by filling up the thermometer to this mark on the tick mark scale (on the right of the thermometer).
- Adding the ° C suffix at the end of the values.
<value>-40</value>
</chart>
First of all comes the <chart> element which is the starting element for any chart that you create using FusionWidgets. Now we define the lower and upper limits of the gauge scale. To define the limits, we use the lowerLimit and upperLimit attributes of the <chart> element.
We also set the palette number and degree character as number suffix.