FusionMaps with ASP.NET (VB) > Using Data from Form
For the sake of demo, let us take the example of a fictional company that wants to plot the world-wide sales report for a particular day on a map.
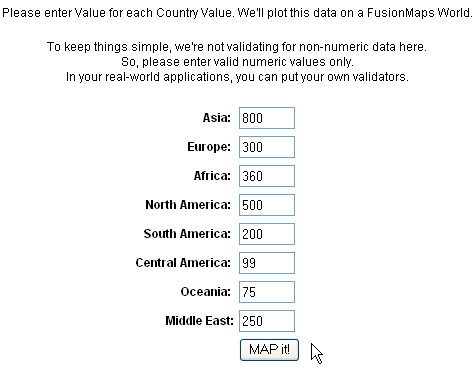
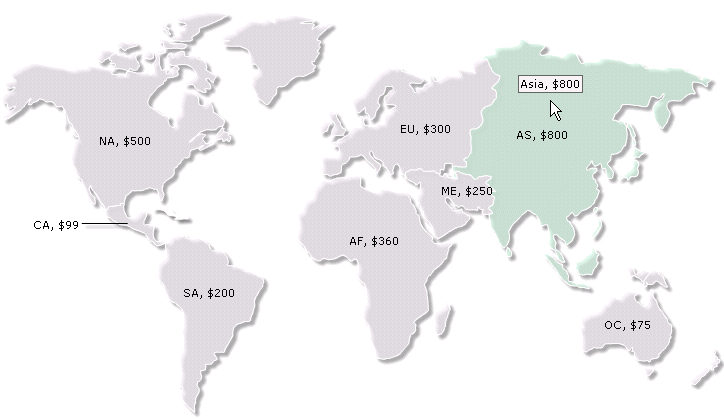
The example first loads a page that has a form to accept data for all the continents. Here, we have put some default data which can be modified as per user's wish. This data will be submitted to another ASP.NET (VB) page. This page will acquire the data and plot it on the map. For the sake of simplicity, we wouldn't do any processing or checking on this data. However, your real life applications might process data before presenting it on the map.

<%@ Page Language="VB" AutoEventWireup="false" CodeFile="FormSubmit.aspx.vb" Inherits="FormBased_FormSubmit" %>
<html >
<head>
<title>FusionMaps v3 - Form Based Example</title>
<script language="Javascript" src="../JSClass/FusionMaps.js"></script>
</head>
<body>
<form id='form1' name='form1' method='post' runat="server">
<% ' Show the Map %>
<asp:Literal ID="FusionMapsContainer" runat="server"/>
</form>
</body>
</html>
Imports InfoSoftGlobal 'FusionMaps.dll in bin folder
Partial Class FormBased_FormSubmit
Inherits System.Web.UI.Page
''' <summary>
''' This program takes Maps Request value and convert into an Array
''' finally converts the data into FusionMaps dataXML to render map
''' </summary>
Protected Sub Page_Load(ByVal ob As Object, ByVal e As EventArgs) Handles Me.Load
' Define dataArray Two dimension string Array element. 1st column take
' map internal id and 2nd column take Value.
Dim dataArray(8, 2) As String
' Array data assigned from Context object Items
' In this example, we're directly showing this data back on chart.
' In your apps, you can do the required processing and then show the
' relevant data only.
dataArray(1, 1) = "01" : dataArray(1, 2) = Context.Items("AS1")
dataArray(2, 1) = "02" : dataArray(2, 2) = Context.Items("EU")
dataArray(3, 1) = "03" : dataArray(3, 2) = Context.Items("AF")
dataArray(4, 1) = "04" : dataArray(4, 2) = Context.Items("NA")
dataArray(5, 1) = "05" : dataArray(5, 2) = Context.Items("SA")
dataArray(6, 1) = "06" : dataArray(6, 2) = Context.Items("CA")
dataArray(7, 1) = "07" : dataArray(7, 2) = Context.Items("OC")
dataArray(8, 1) = "08" : dataArray(8, 2) = Context.Items("ME1")
'Now that we've the data in variables, we need to convert this into XML.
'The simplest method to convert data into XML is using string concatenation.
Dim strXML As New StringBuilder
'Initialize <map> element
strXML.Append("<map borderColor='FFFFFF' connectorColor='000000' fillAlpha='70' hoverColor='FFFFFF' showBevel='0'>")
' Set colorRange's Maximum and minimum value for displaying color range
strXML.Append("<colorRange>")
strXML.Append("<color minValue='1' maxValue='350' displayValue='Population - 1 to 350' color='CC0001' />")
strXML.Append("<color minValue='350' maxValue='500' displayValue='Population - 350 to 500' color='FFD33A' />")
strXML.Append("<color minValue='500' maxValue='700' displayValue='Population - 500 to 700' color='069F06' />")
strXML.Append("<color minValue='700' maxValue='1000' displayValue='Population - 700 or above' color='ABF456' />")
strXML.Append("</colorRange><data>")
Dim i As Integer
'Fatch Data from array
For i = 1 To UBound(dataArray)
' Set each map <entity> id and value
strXML.Append("<entity id='" & dataArray(i, 1) & "' value='" & dataArray(i, 2) & "' />") Next
' Close <data> element
strXML.Append("</data>")
' Add Style on map
strXML.Append("<styles><definition><style type='animation' name='animX' param='_xscale' start='0' duration='1' /><style type='animation' name='animY' param='_yscale' start='0' duration='1' />")
strXML.Append("</definition><application><apply toObject='PLOT' styles='animX,animY' /></application></styles>")
' Close <map> element
strXML.Append("</map>")
' Create Map embedding HTML with data contained in strXML
' We use FusionMaps class of InfoSoftGlobal namespace (FusionMaps.dll in BIN folder)
' RenderMap() generates the necessary HTML needed to render the map
Dim mapHTML As String = FusionMaps.RenderMap("../Maps/FCMap_World8.swf", "", strXML.ToString(), "mapid", "600", "400", False, False)
'embed the chart rendered as HTML into Literal - FusionMapsContainer
FusionMapsContainer.Text = mapHTML
End Sub
End Class
- Requesting data from the submitted form and storing it in local array - dataArray.
- Creating an XML data document using string concatenation and storing it in strXML StringBuilder object by iterating through dataArray.
- Using InfosoftGlobal assembly's FusionMaps class's renderMap() function to pass strXML as the dataXML for the map and render it in literal control - FusionMapsContainer.
