Showing Custom Labels and tool tips for entities
You can show custom labels and tool tips for any entity on the map. To do so, just add the following to XML:
<map borderColor='005879' fillColor='D7F4FF'
numberSuffix=' Mill.' includeValueInLabels='1' labelSepChar=': ' baseFontSize='9'>
<data>
<entity id='NA' value='515' />
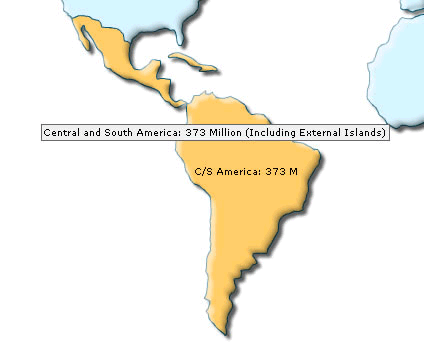
<entity id='SA' value='373' displayValue='C/S
America: 373 M' toolText='Central and South America: 373 Million (Including
External Islands)'/>
<entity id='AS' value='3875' />
<entity id='EU' value='727' />
<entity id='AF' value='885' />
<entity id='AU' value='32' />
</data>
</map>
Here, we've added out custom display value (label) and tool text for South America Entity. When you view the chart, you'll get the following output:
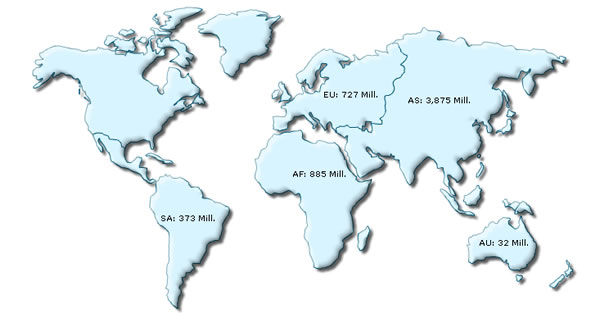
 |
<data>
<entity id='NA' value='515' displayValue=' '/>
<entity id='SA' value='373' />
<entity id='AS' value='3875' />
<entity id='EU' value='727' />
<entity id='AF' value='885' />
<entity id='AU' value='32' />
</data>
</map>

<map … useSNameInLabels='0' includeValueInLabels='0' … >

Now that we've played enough with the configuration options of the map, let's shift to the one of the most important aspects of FusionMaps - defining range based data and colors for better visual interpretation.